
Published: 30 Sept 2018 › Updated: 30 Sept 2018
This week Chart Analysis
EURNZD
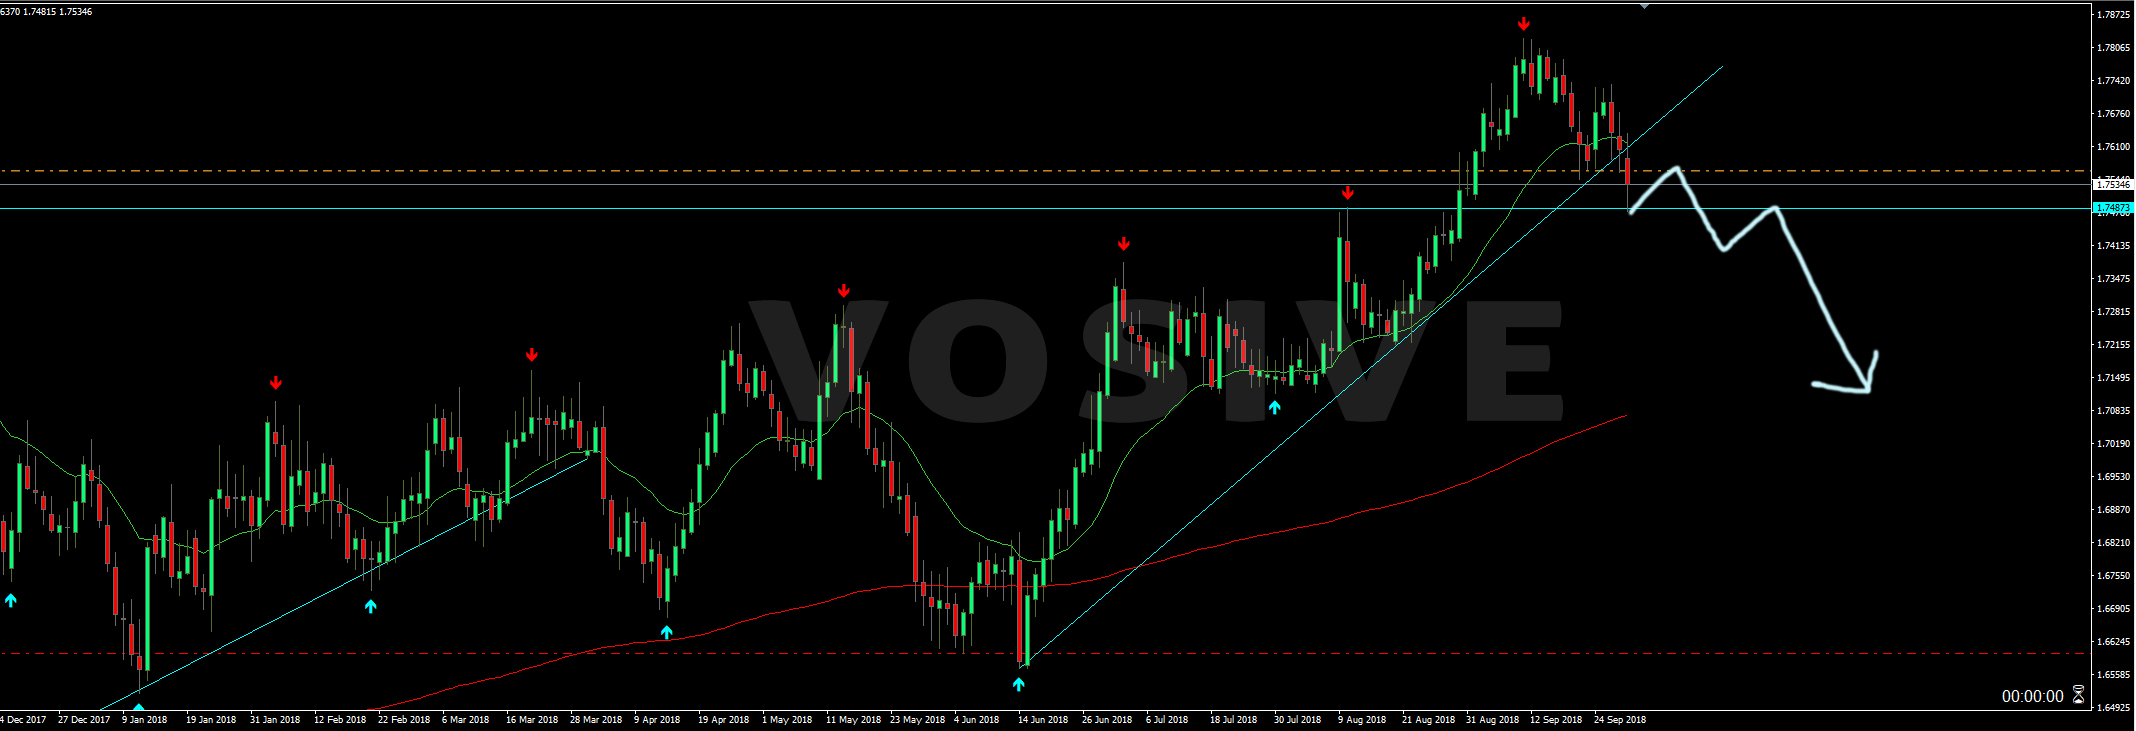
Last week EURO was very bearish, on EURNZD pair weekly chart, we can see price is breaking UpTrend support, price might retest before a hug drop. I already set it to break even. If you have not, you can set your SL above 1.18000 (Long term, suggest using small lot)
EURUSD
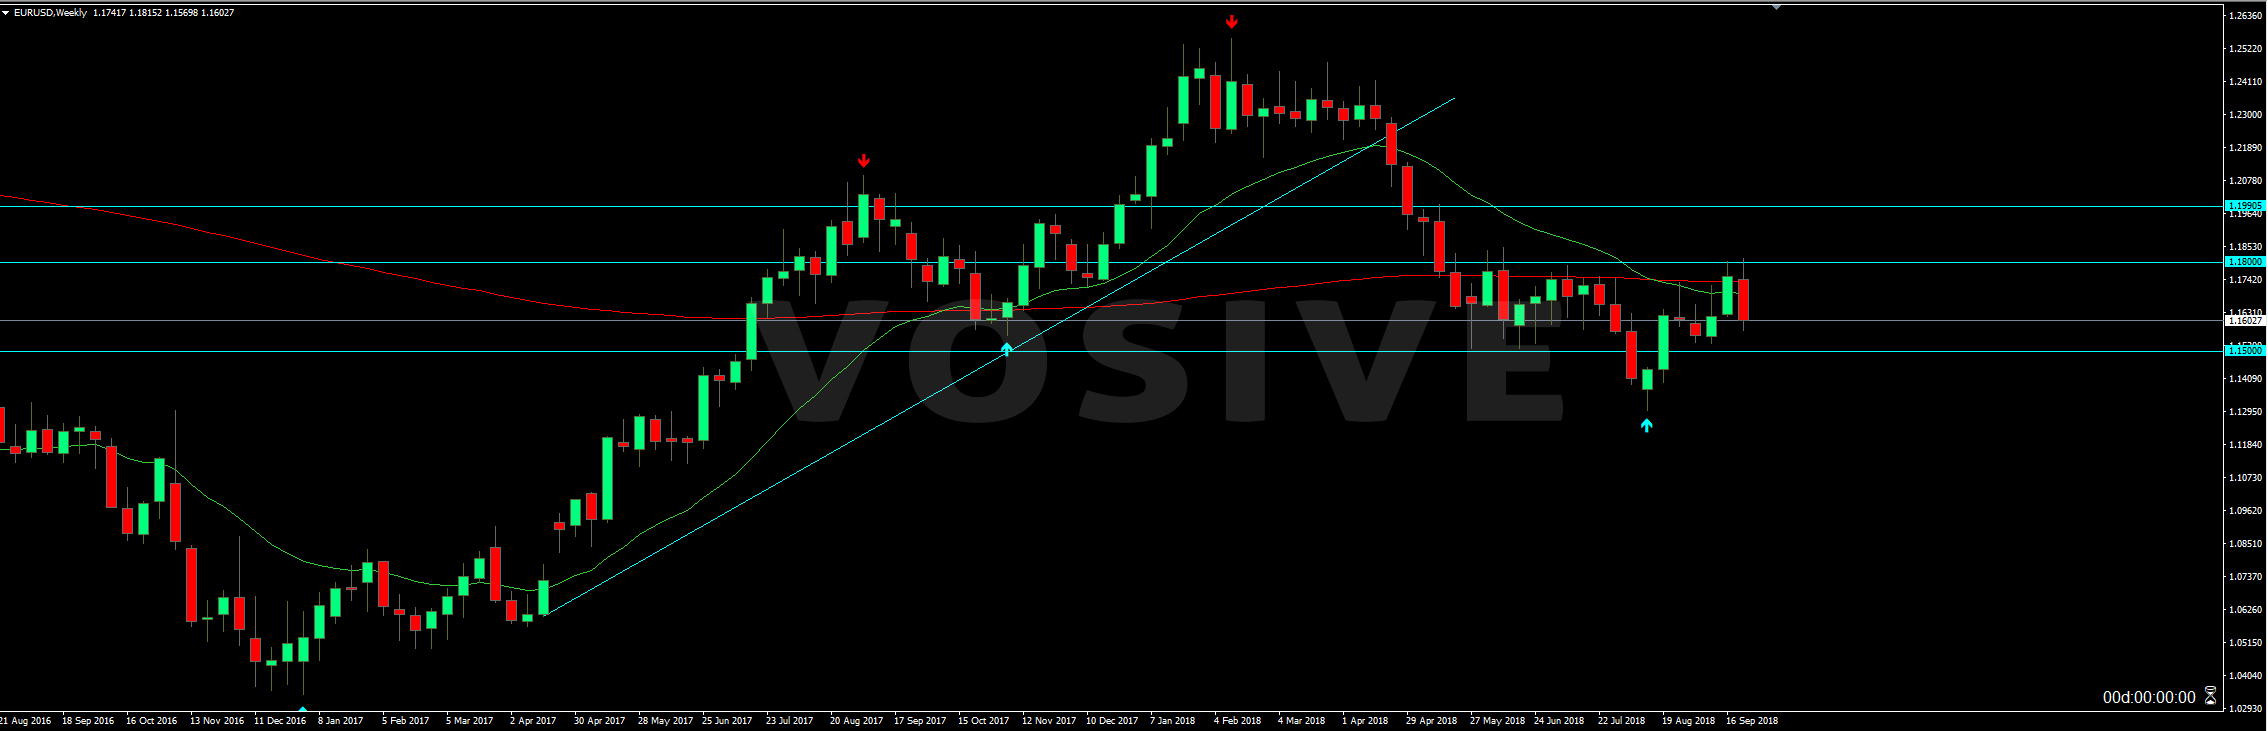
On weekly chart, EURUSD is below SMA200(Red line), 1.18 resistance tested many times, did not break. So this pair will test 1.15 support this week ahead of NFP report on Friday.
Leave This week Chart Analysis to:

Best Posts From VOSIVE
We have not curated any of vosive's posts yet. But you can encourage our curation team to review posts by visiting them regularly and by referring other readers. Because we give priority to frequently read content.
More Posts From VOSIVE
- This week Chart Analysis
- What is Pantos? And where to buy it?
- Today Chart - BTCUSD
- Today Chart - NZDJPY, EURAUD, GOLD
- Today Chart - XRPUSD, ETHUSD, GBPAUD
- Remember our AUDNZD weekly chart?
- Today Chart - EURUSD, AUDNZD, NZDUSD
- Today Chart - EURNZD, USDCAD
- Today Chart - DXY, EURUSD, GBPUSD, GBPAUD, USDCHF
- Today Chart - EURUSD, EURNZD, AUDUSD, USDCHF