
Forex Technical Analysis 11S18
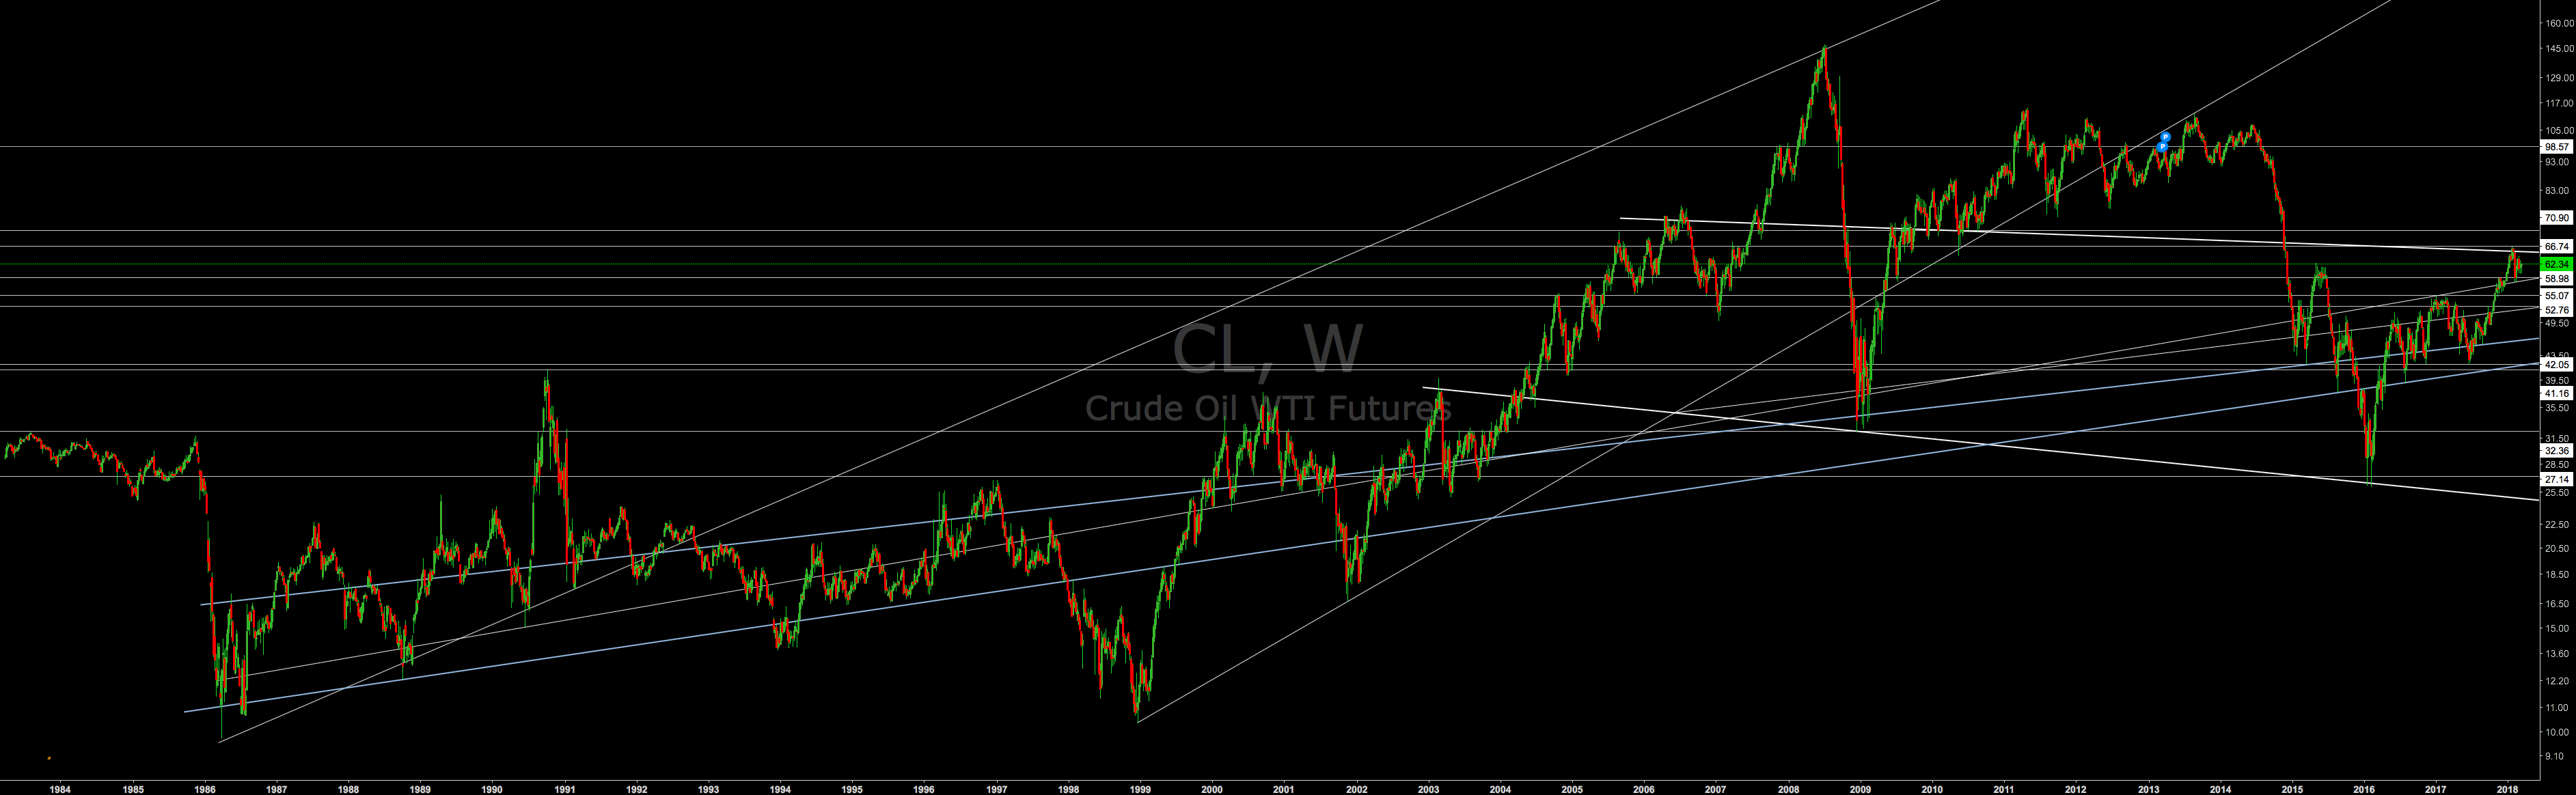
XTIUSD
This chart is from investing.com with a logarithmic scale. Way nicer than USDWTI on tradingview.com. Here is an inflation adjusted long-term Oil chart. You can't run a PC on oil so a way to 30 is a sure thing.
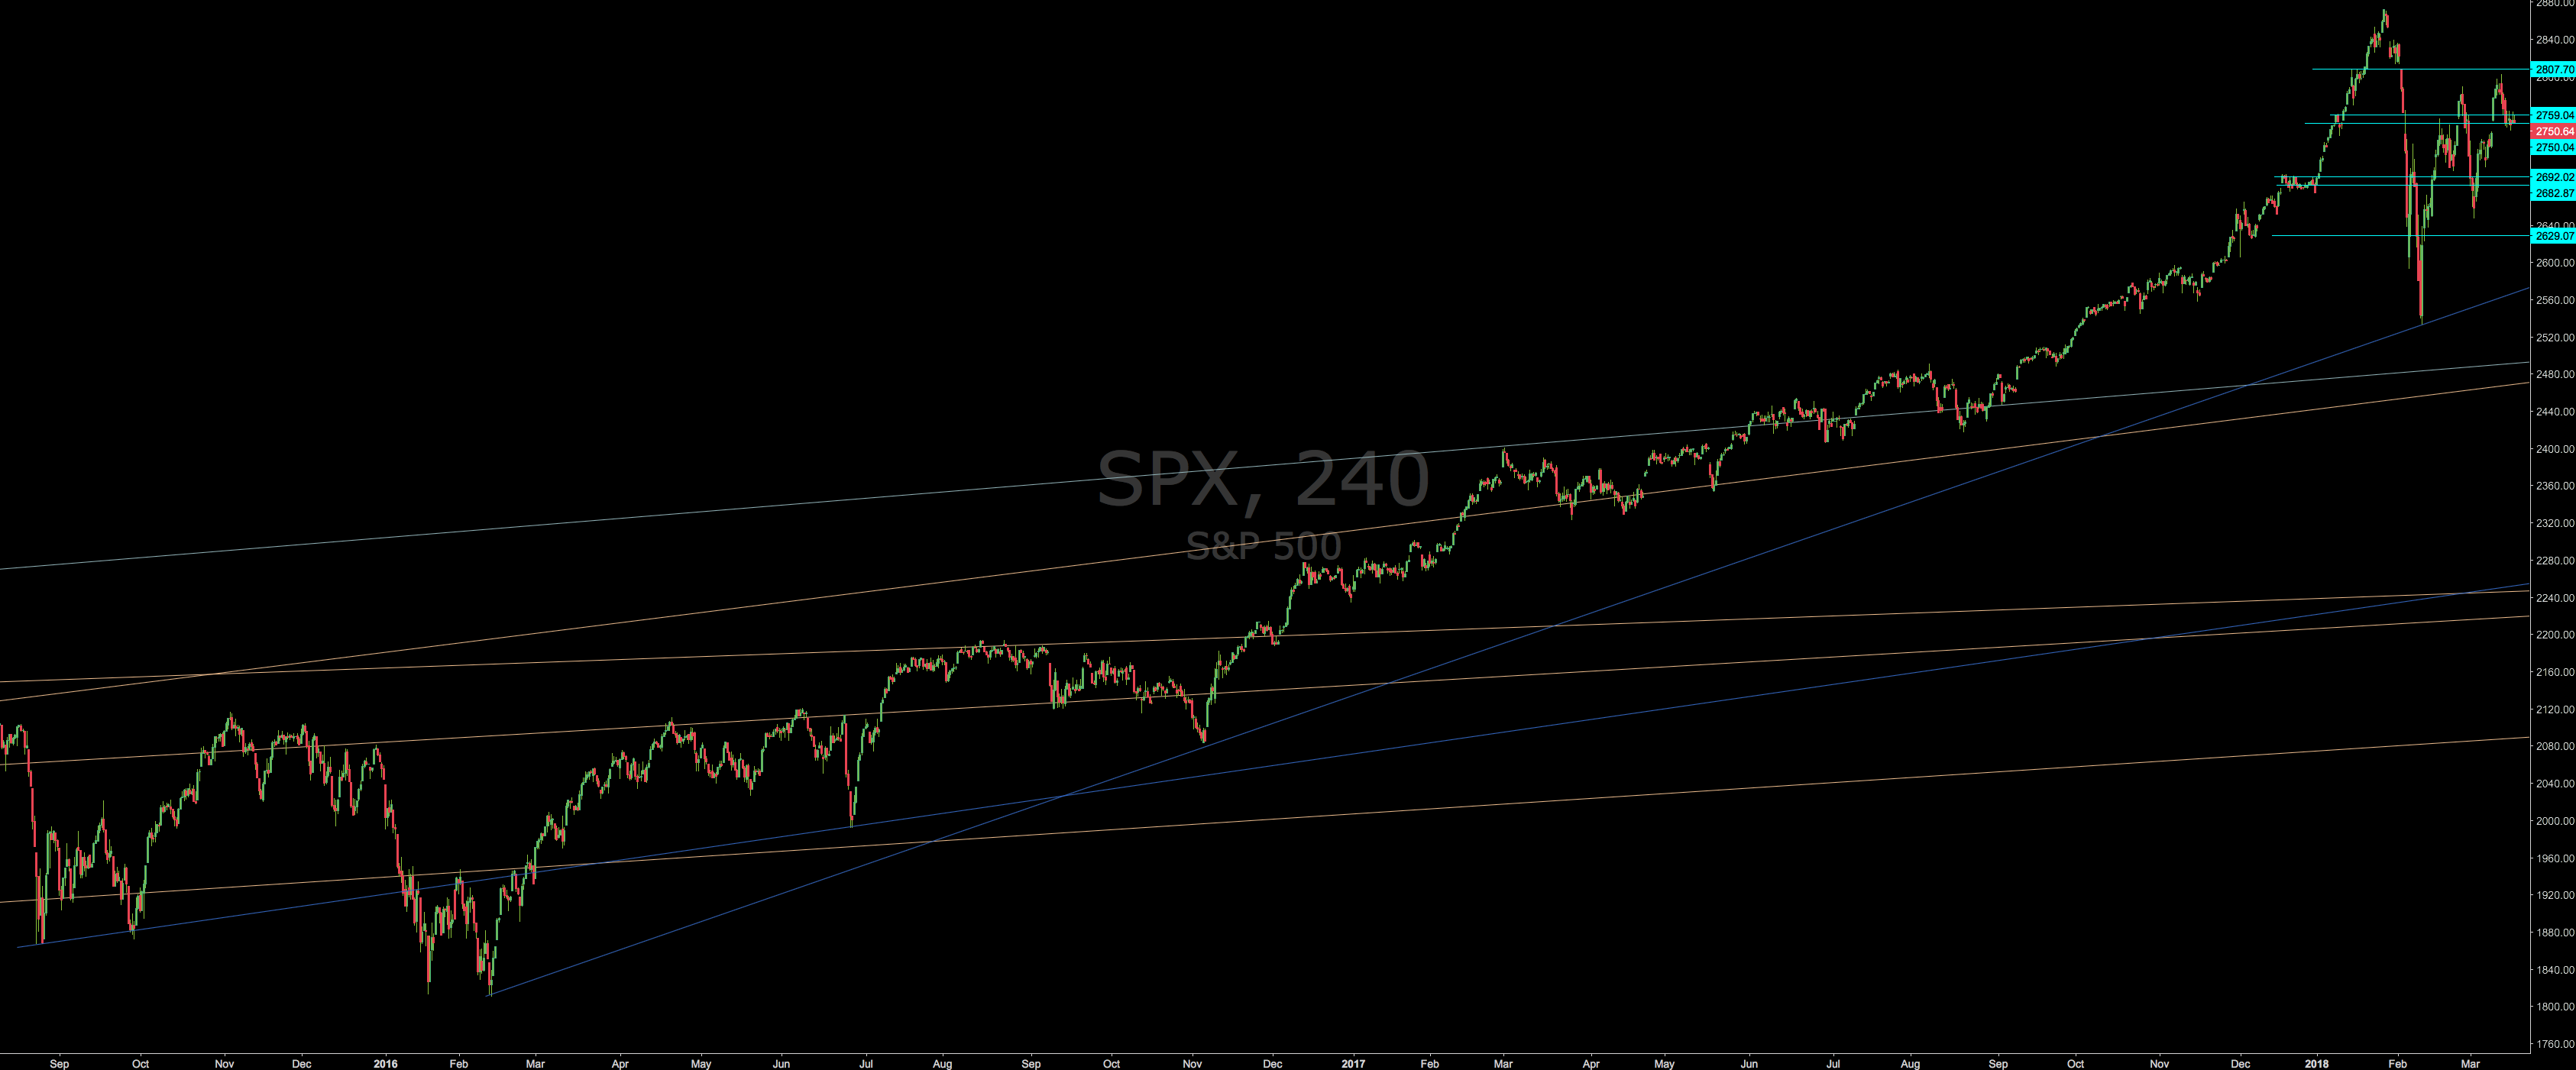
SPX
Hey recession where are you?
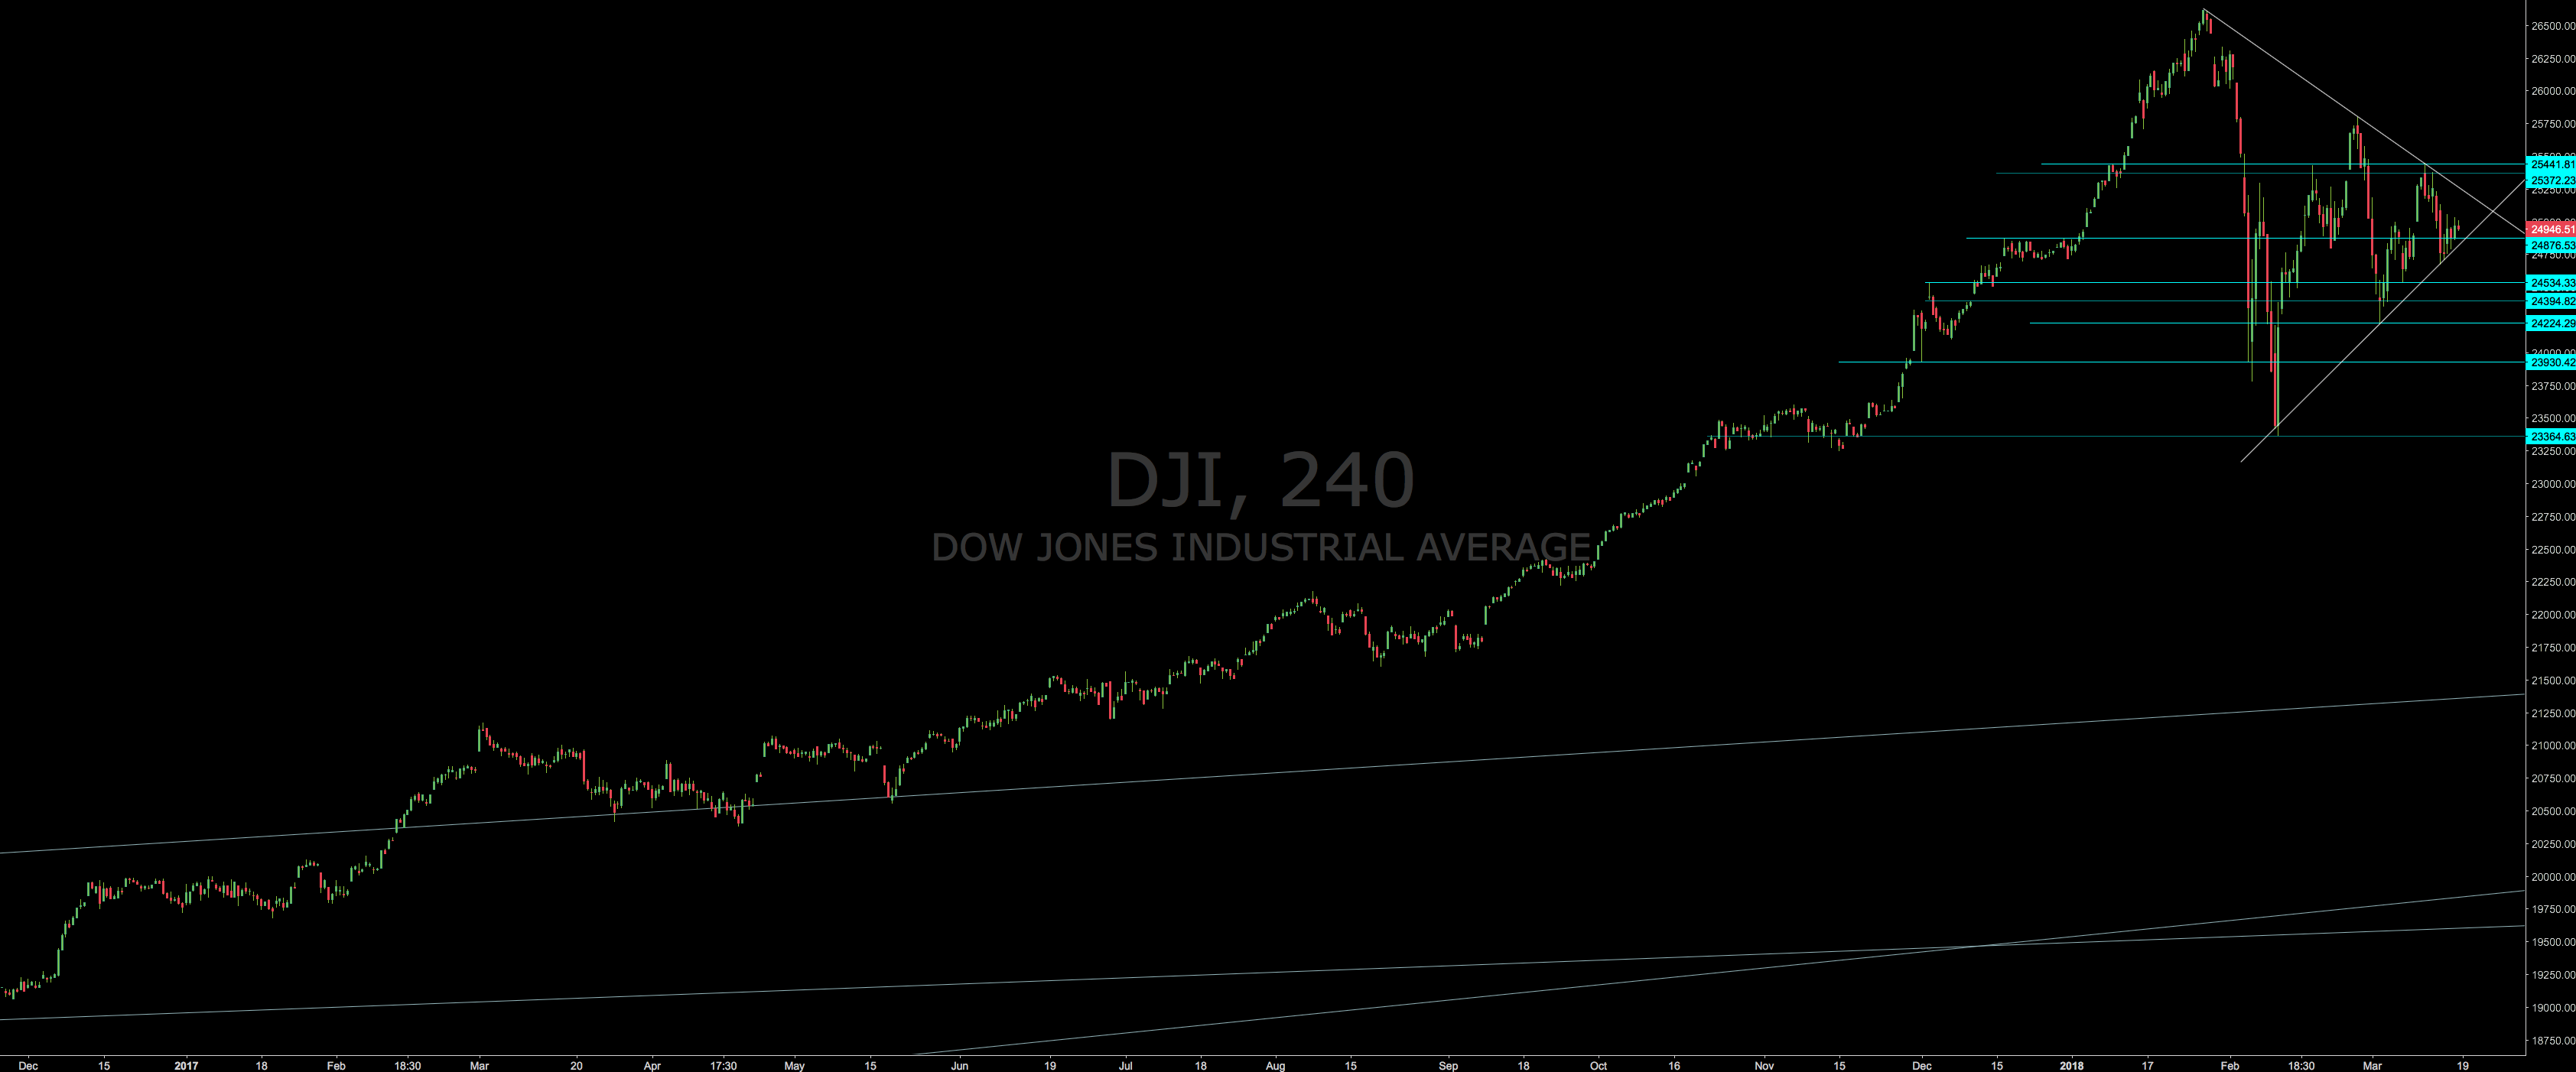
DJI
I think I am going to sell stop this.
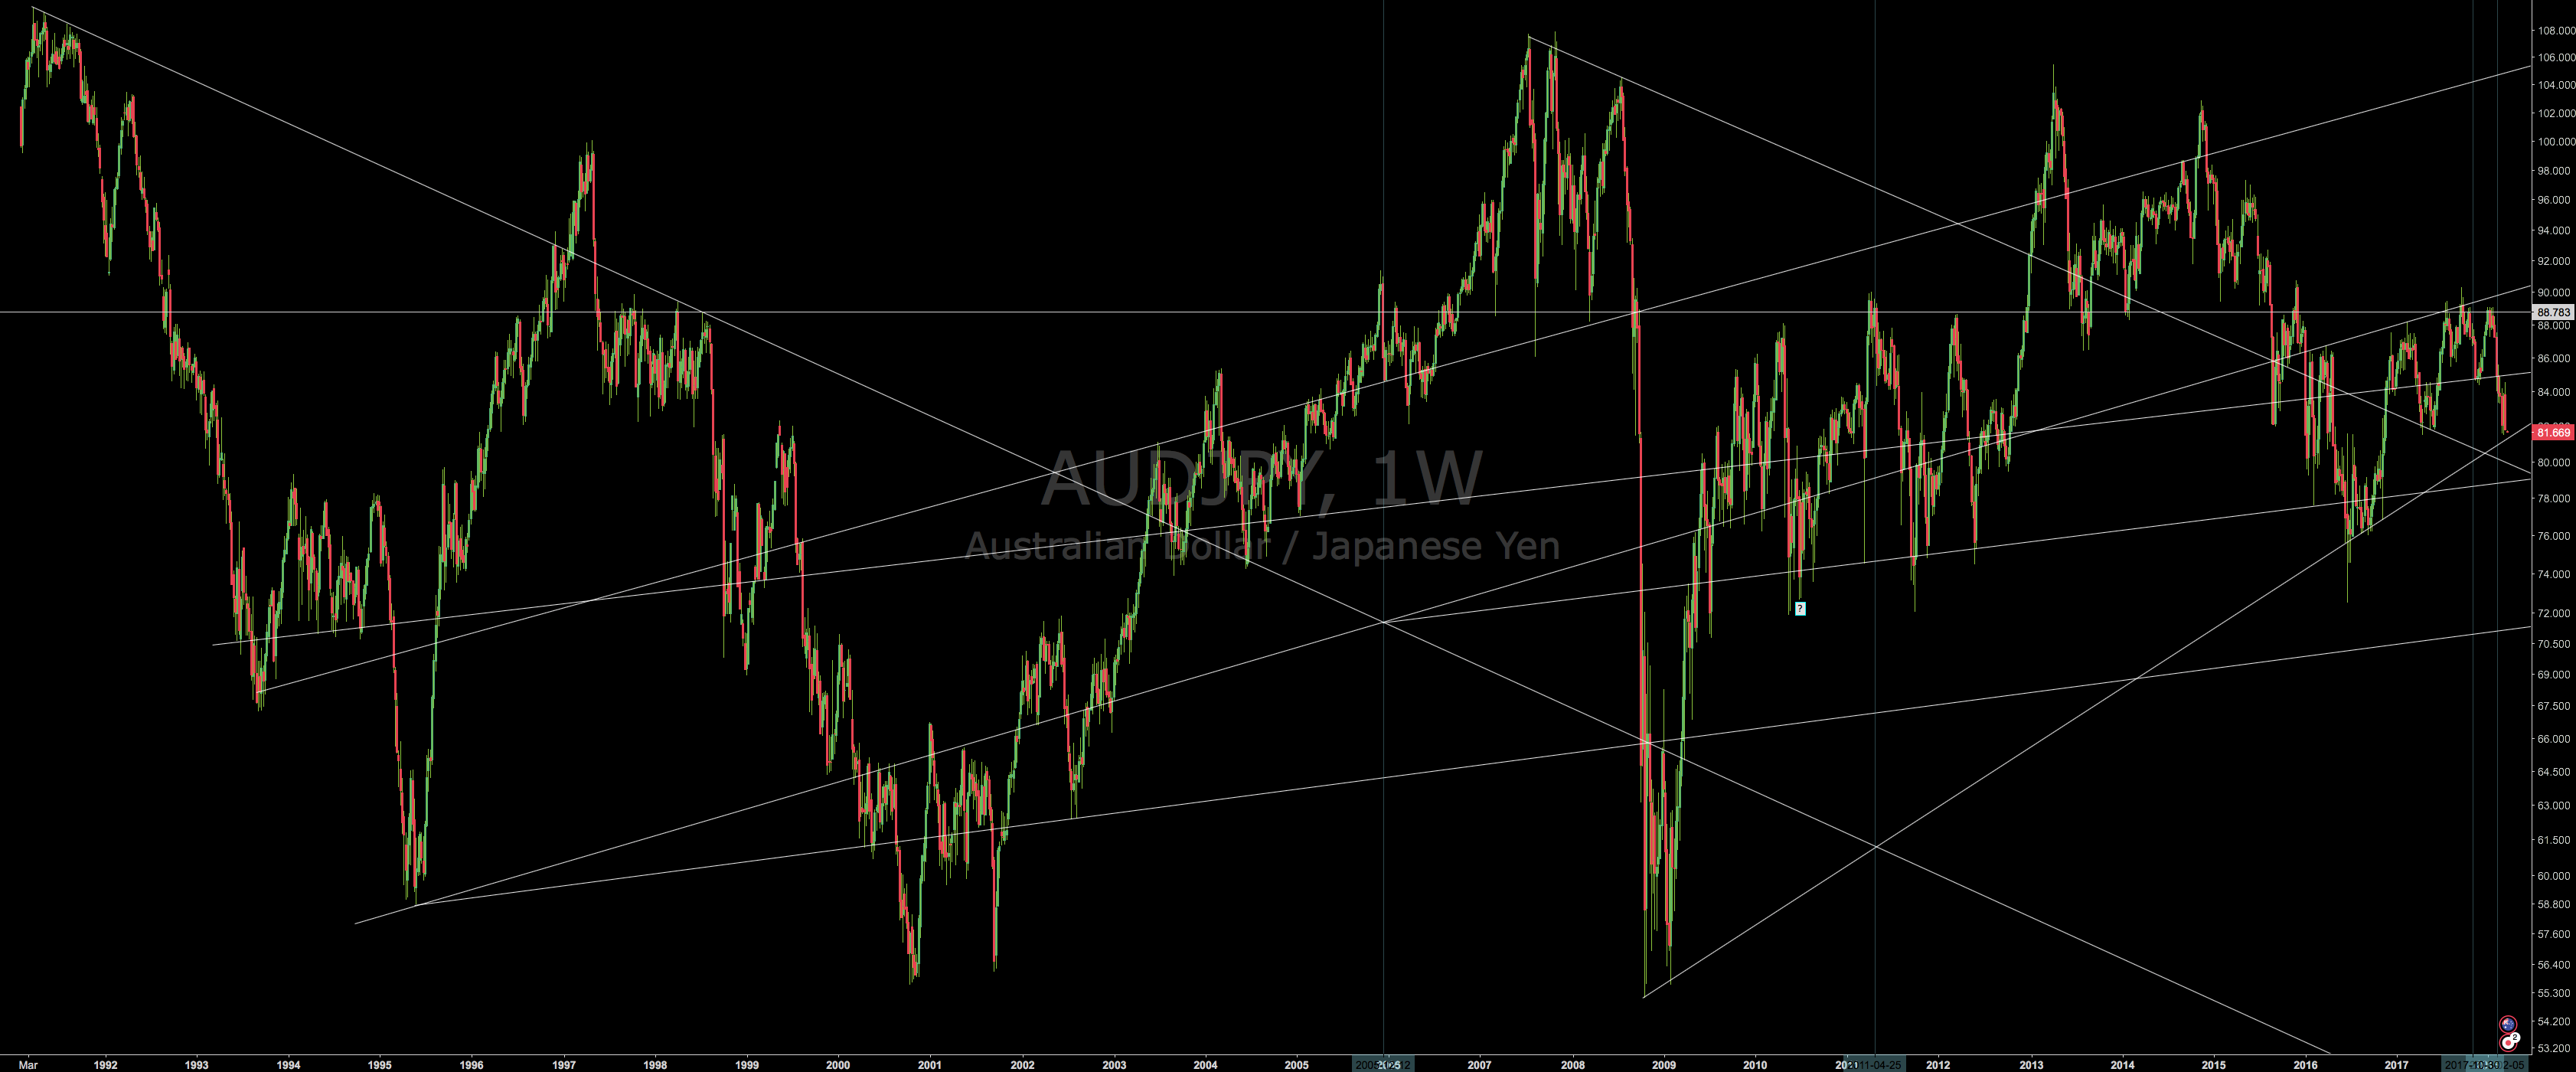
AUDJPY
JPY TA is hidden in a log scale I think.
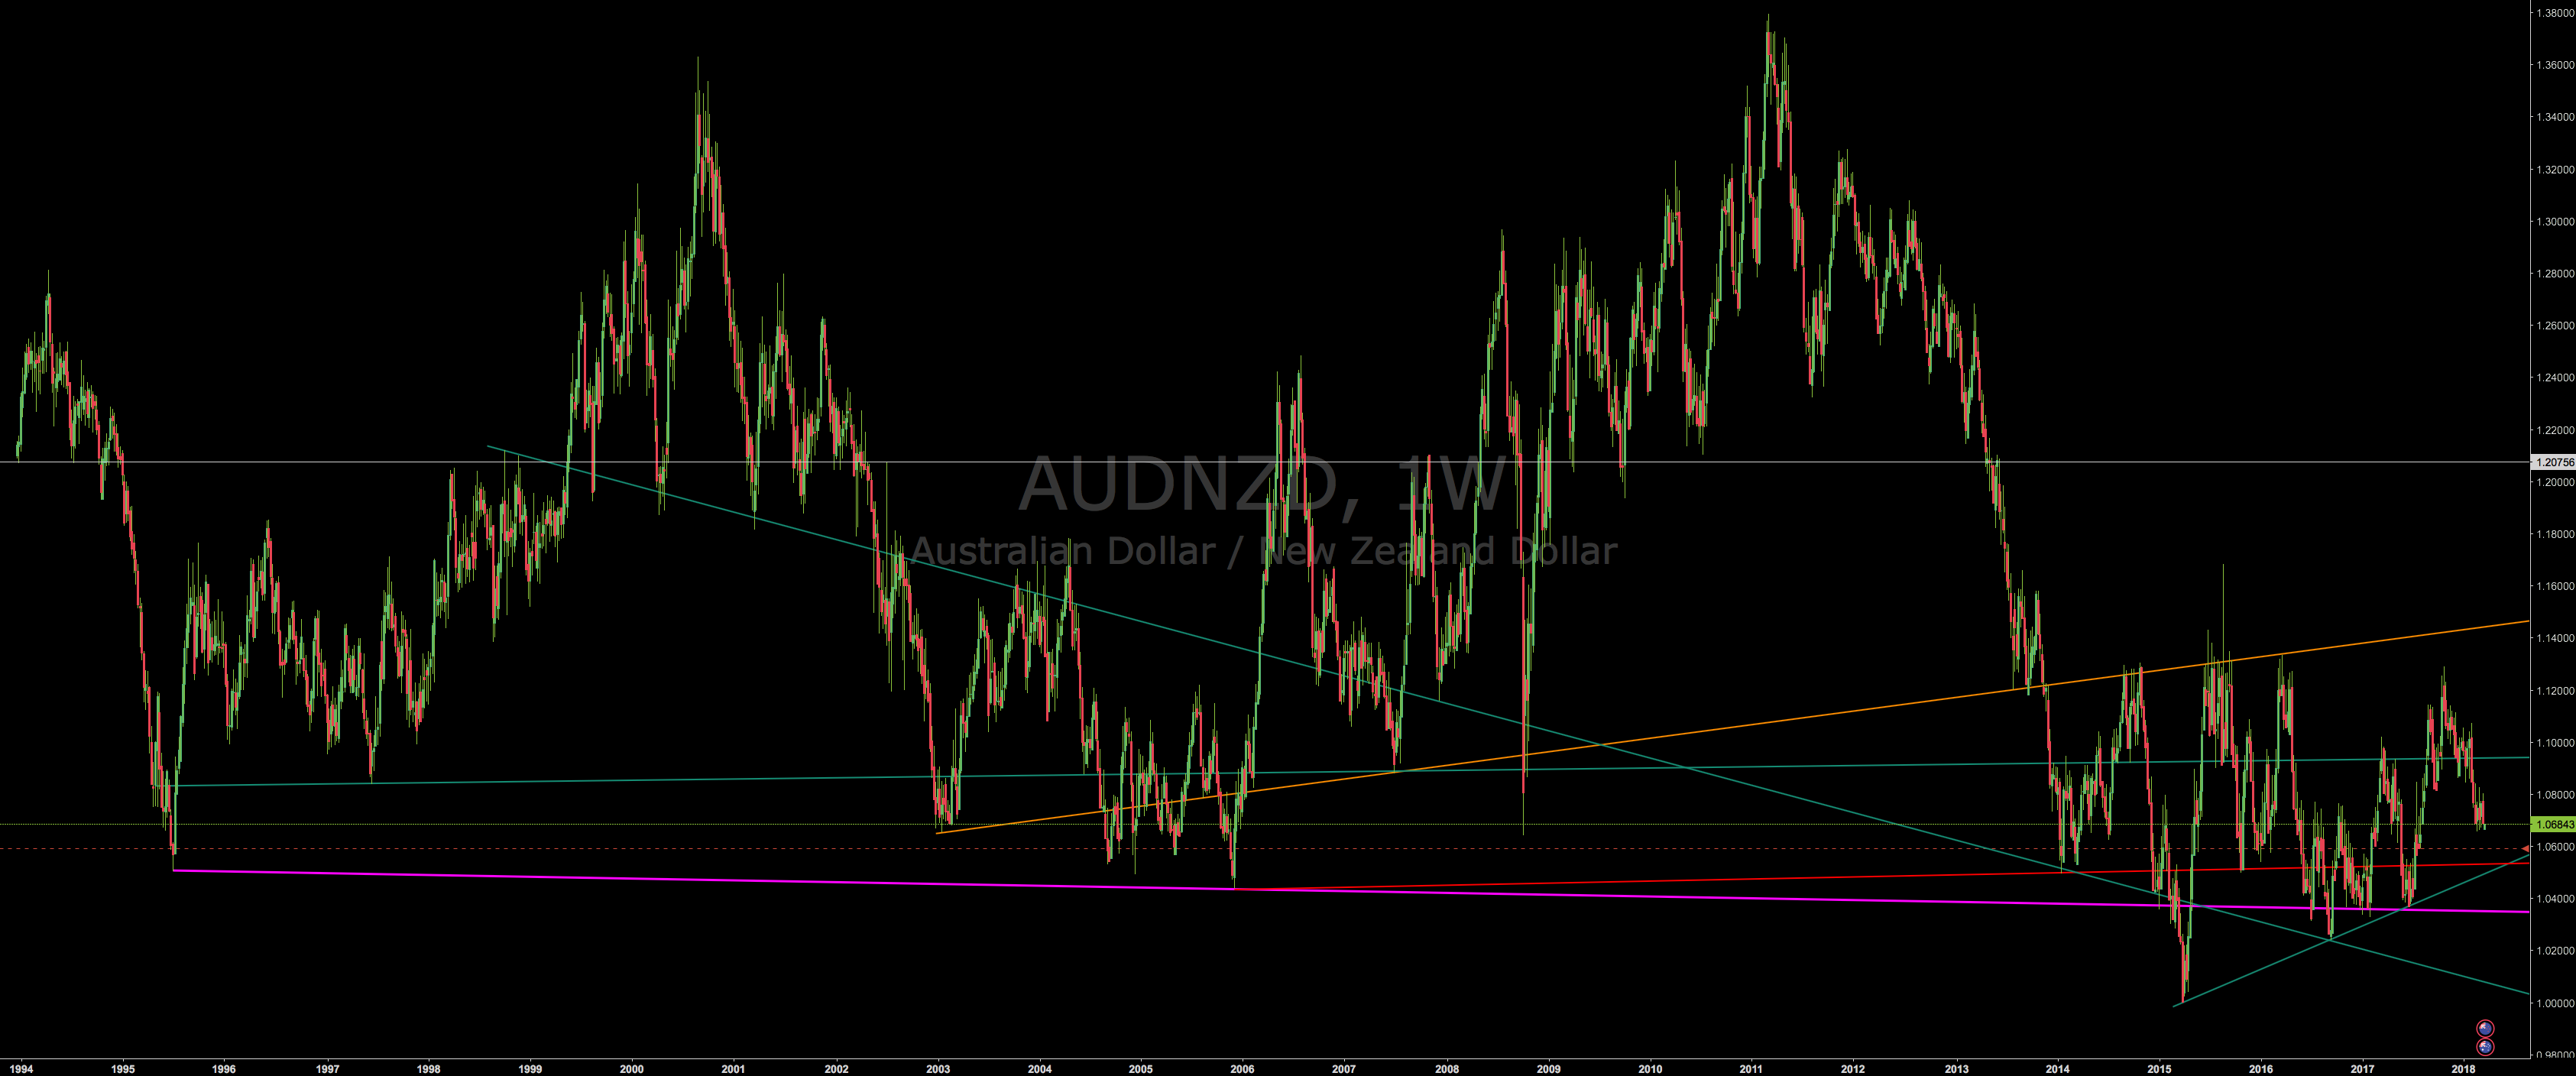
AUDNZD
Three times confirmed an uptrend. I am going to place a buy limit above the red trendline.
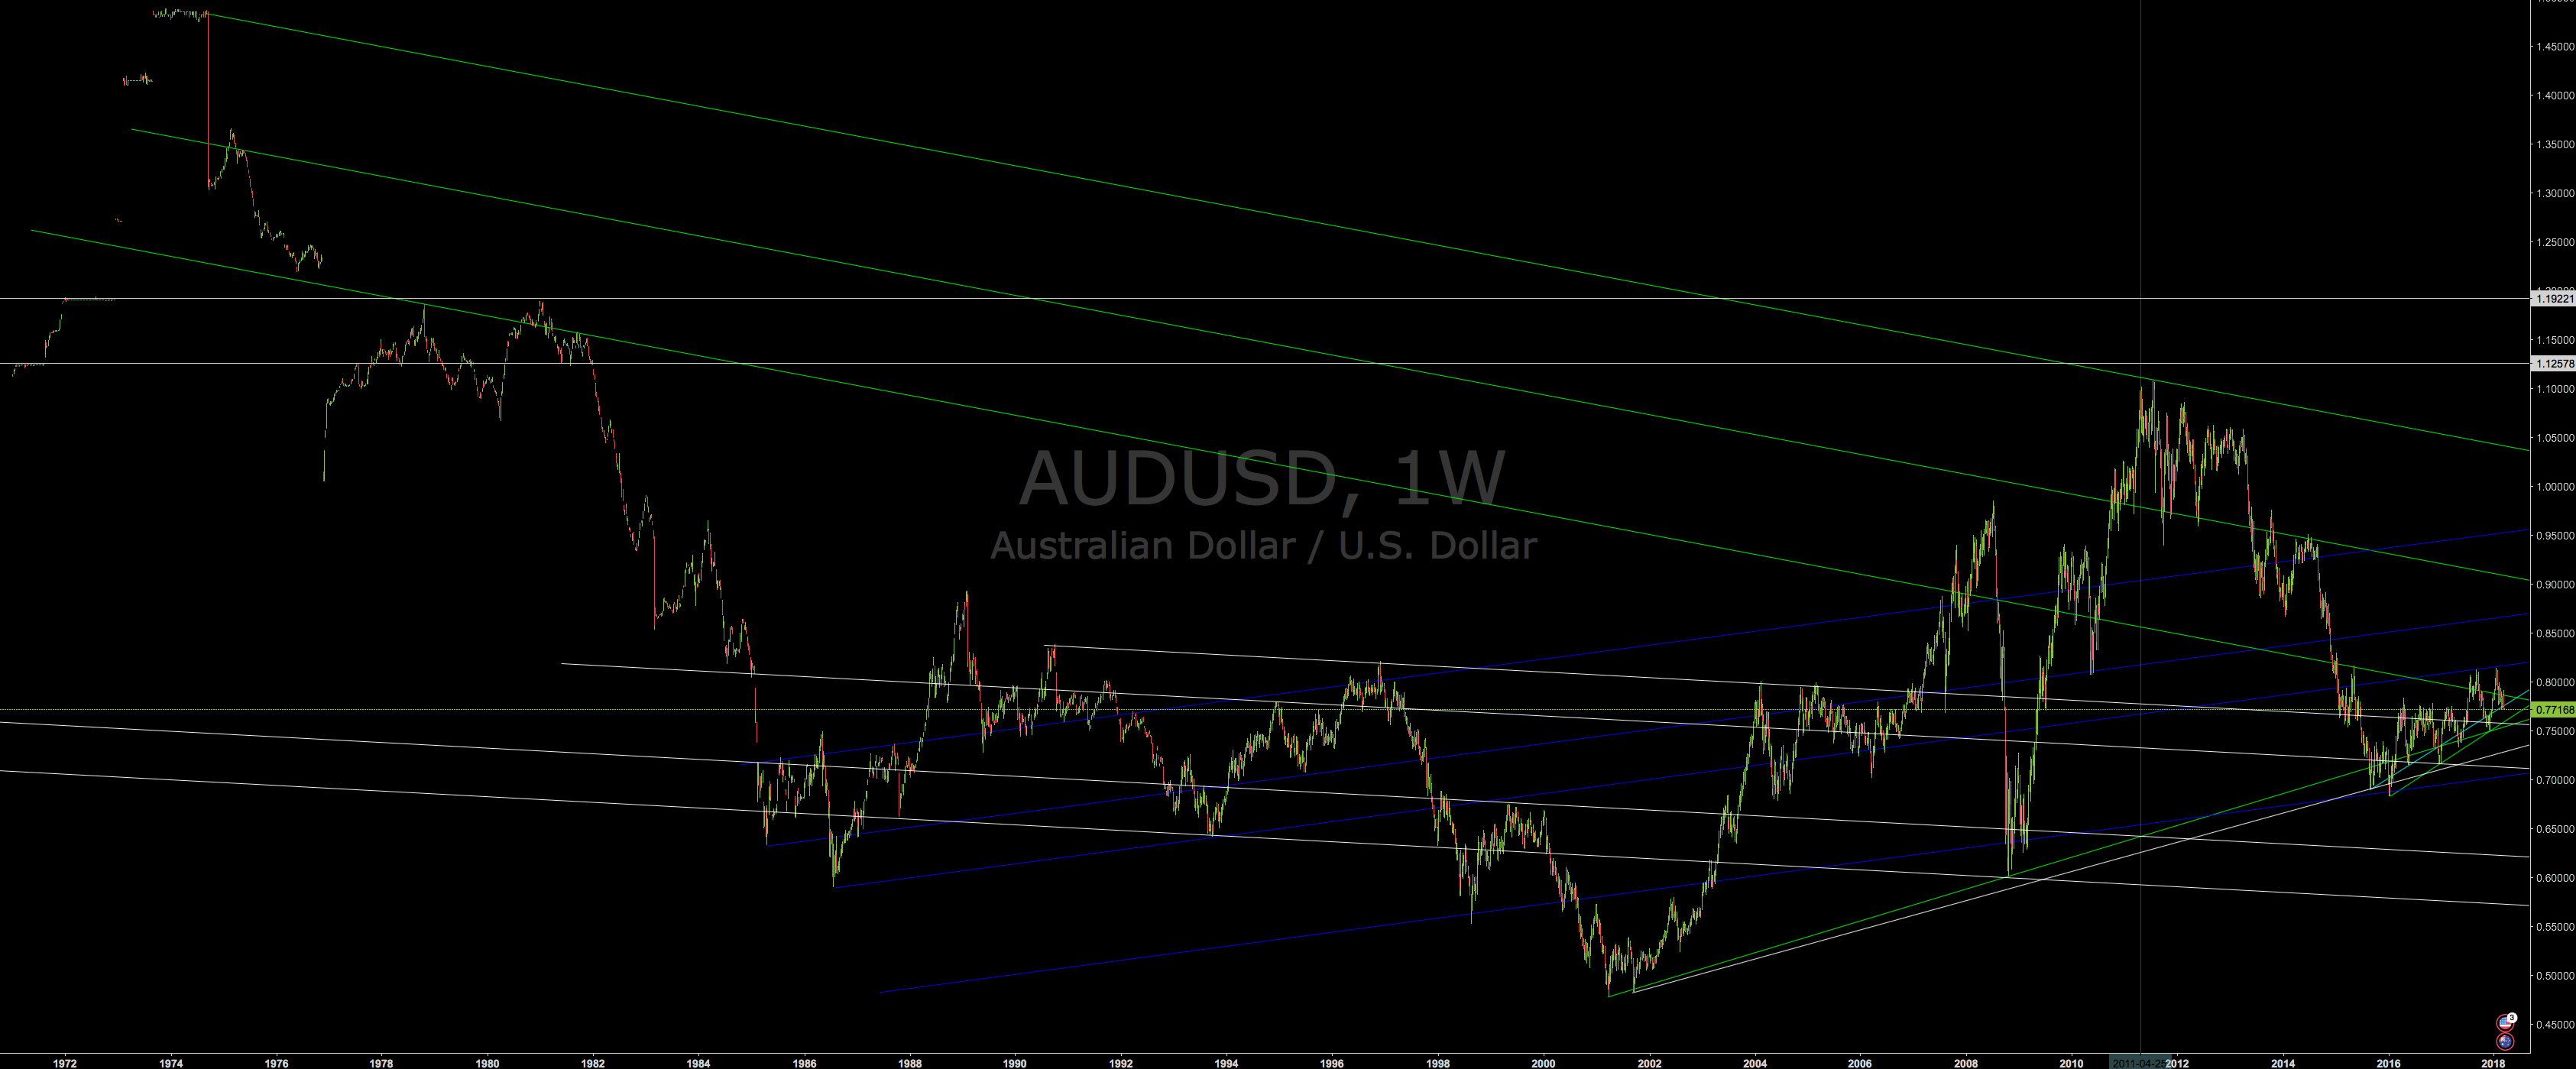
AUDUSD
Volume is necessary to confirm a trend.
Do you know any charting service with a free volume on a weekly/monthly timeframe?
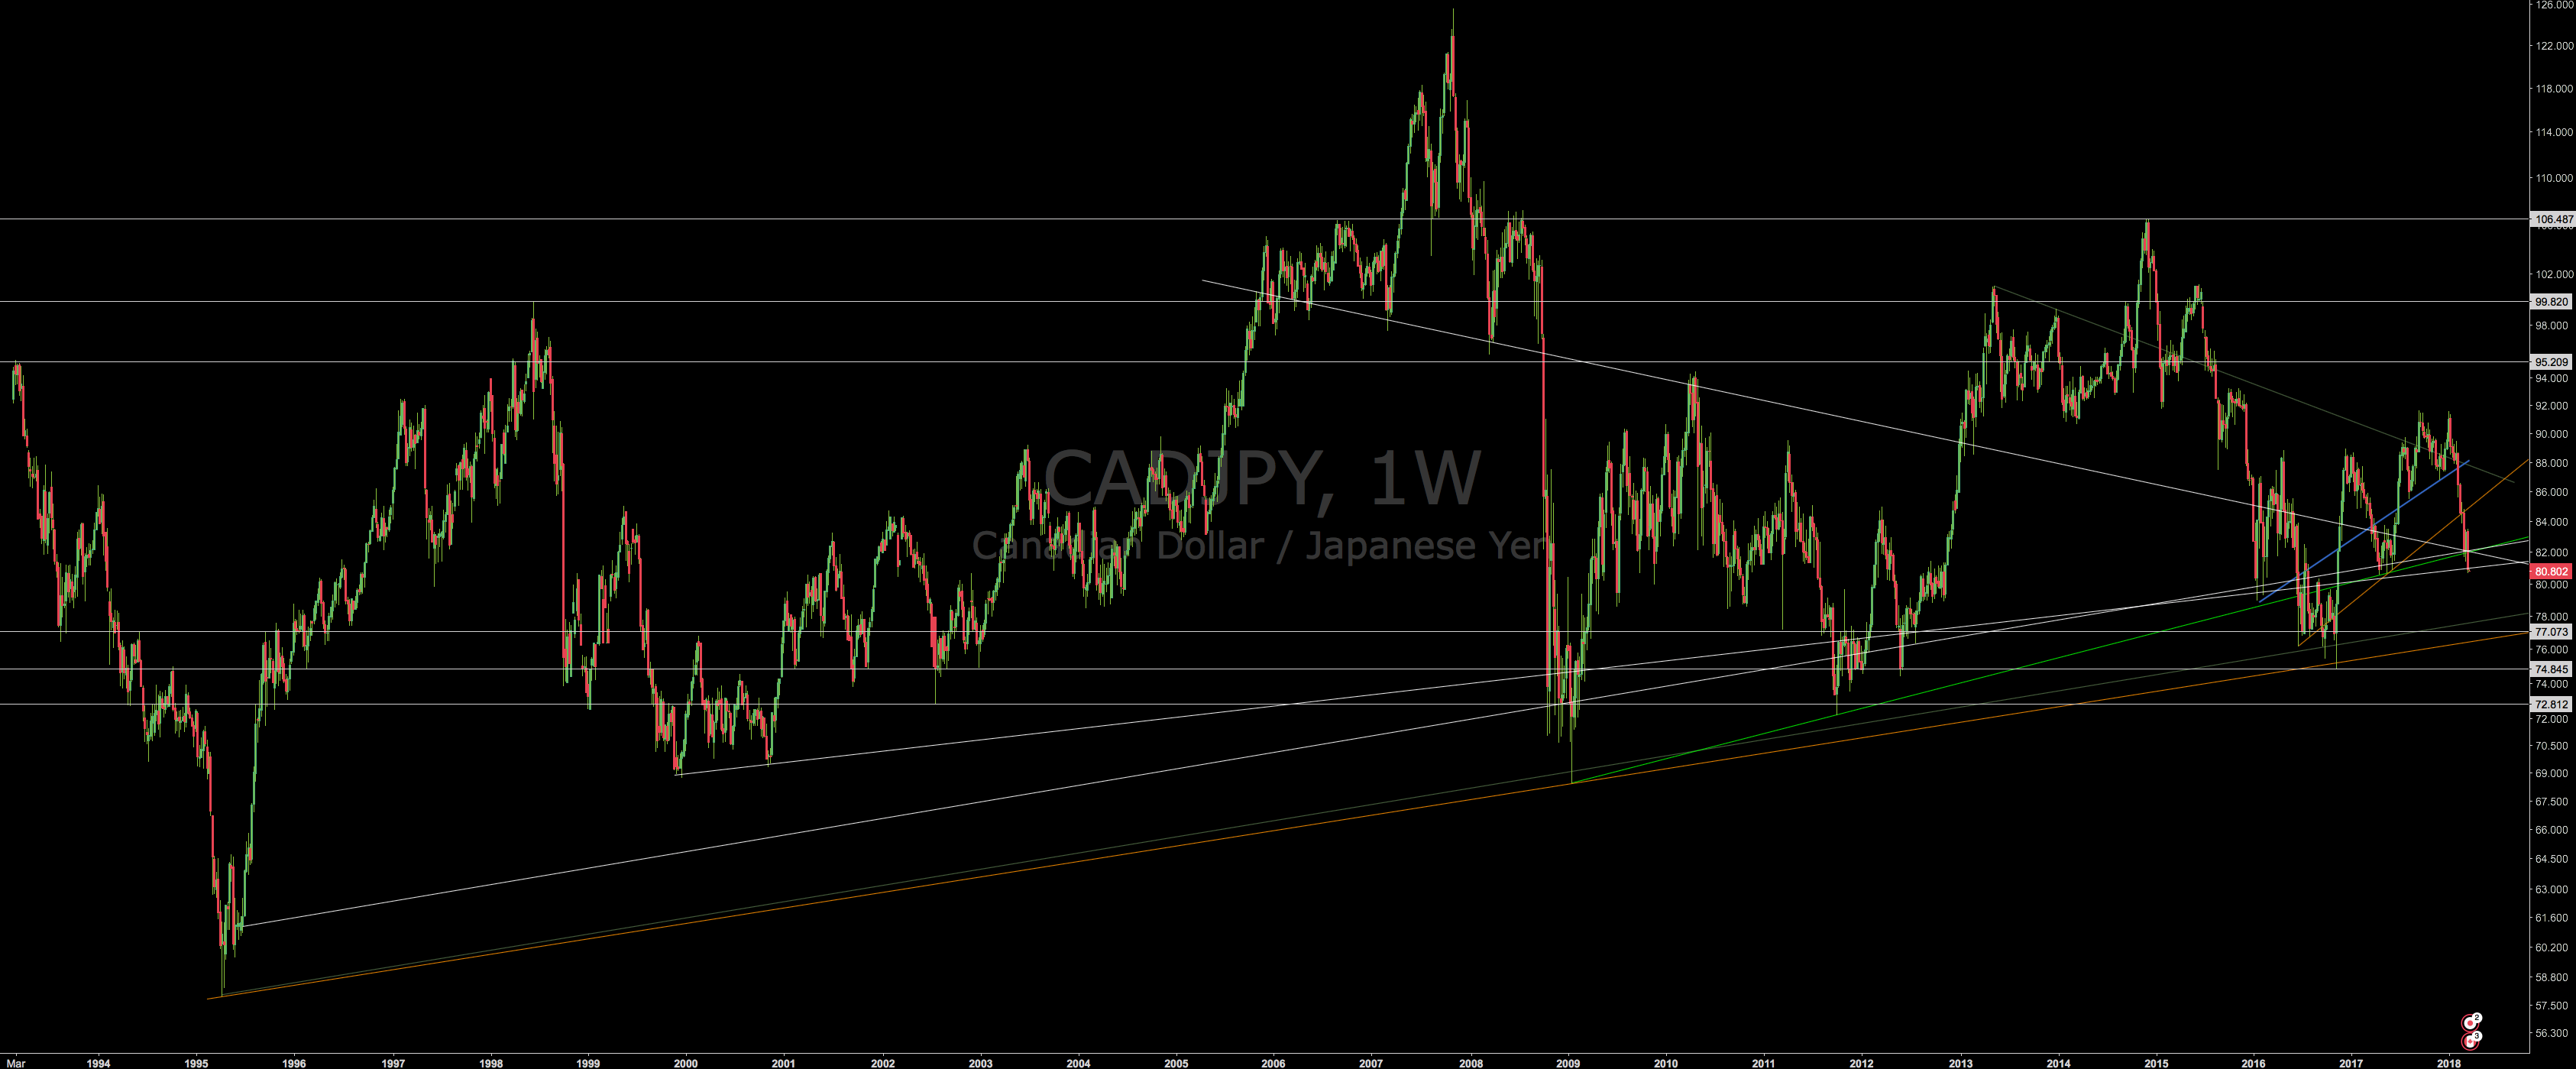
CADJPY
JPY TA definitely encrypted into log scale. Placing a buy-lambo above the orange trendline.
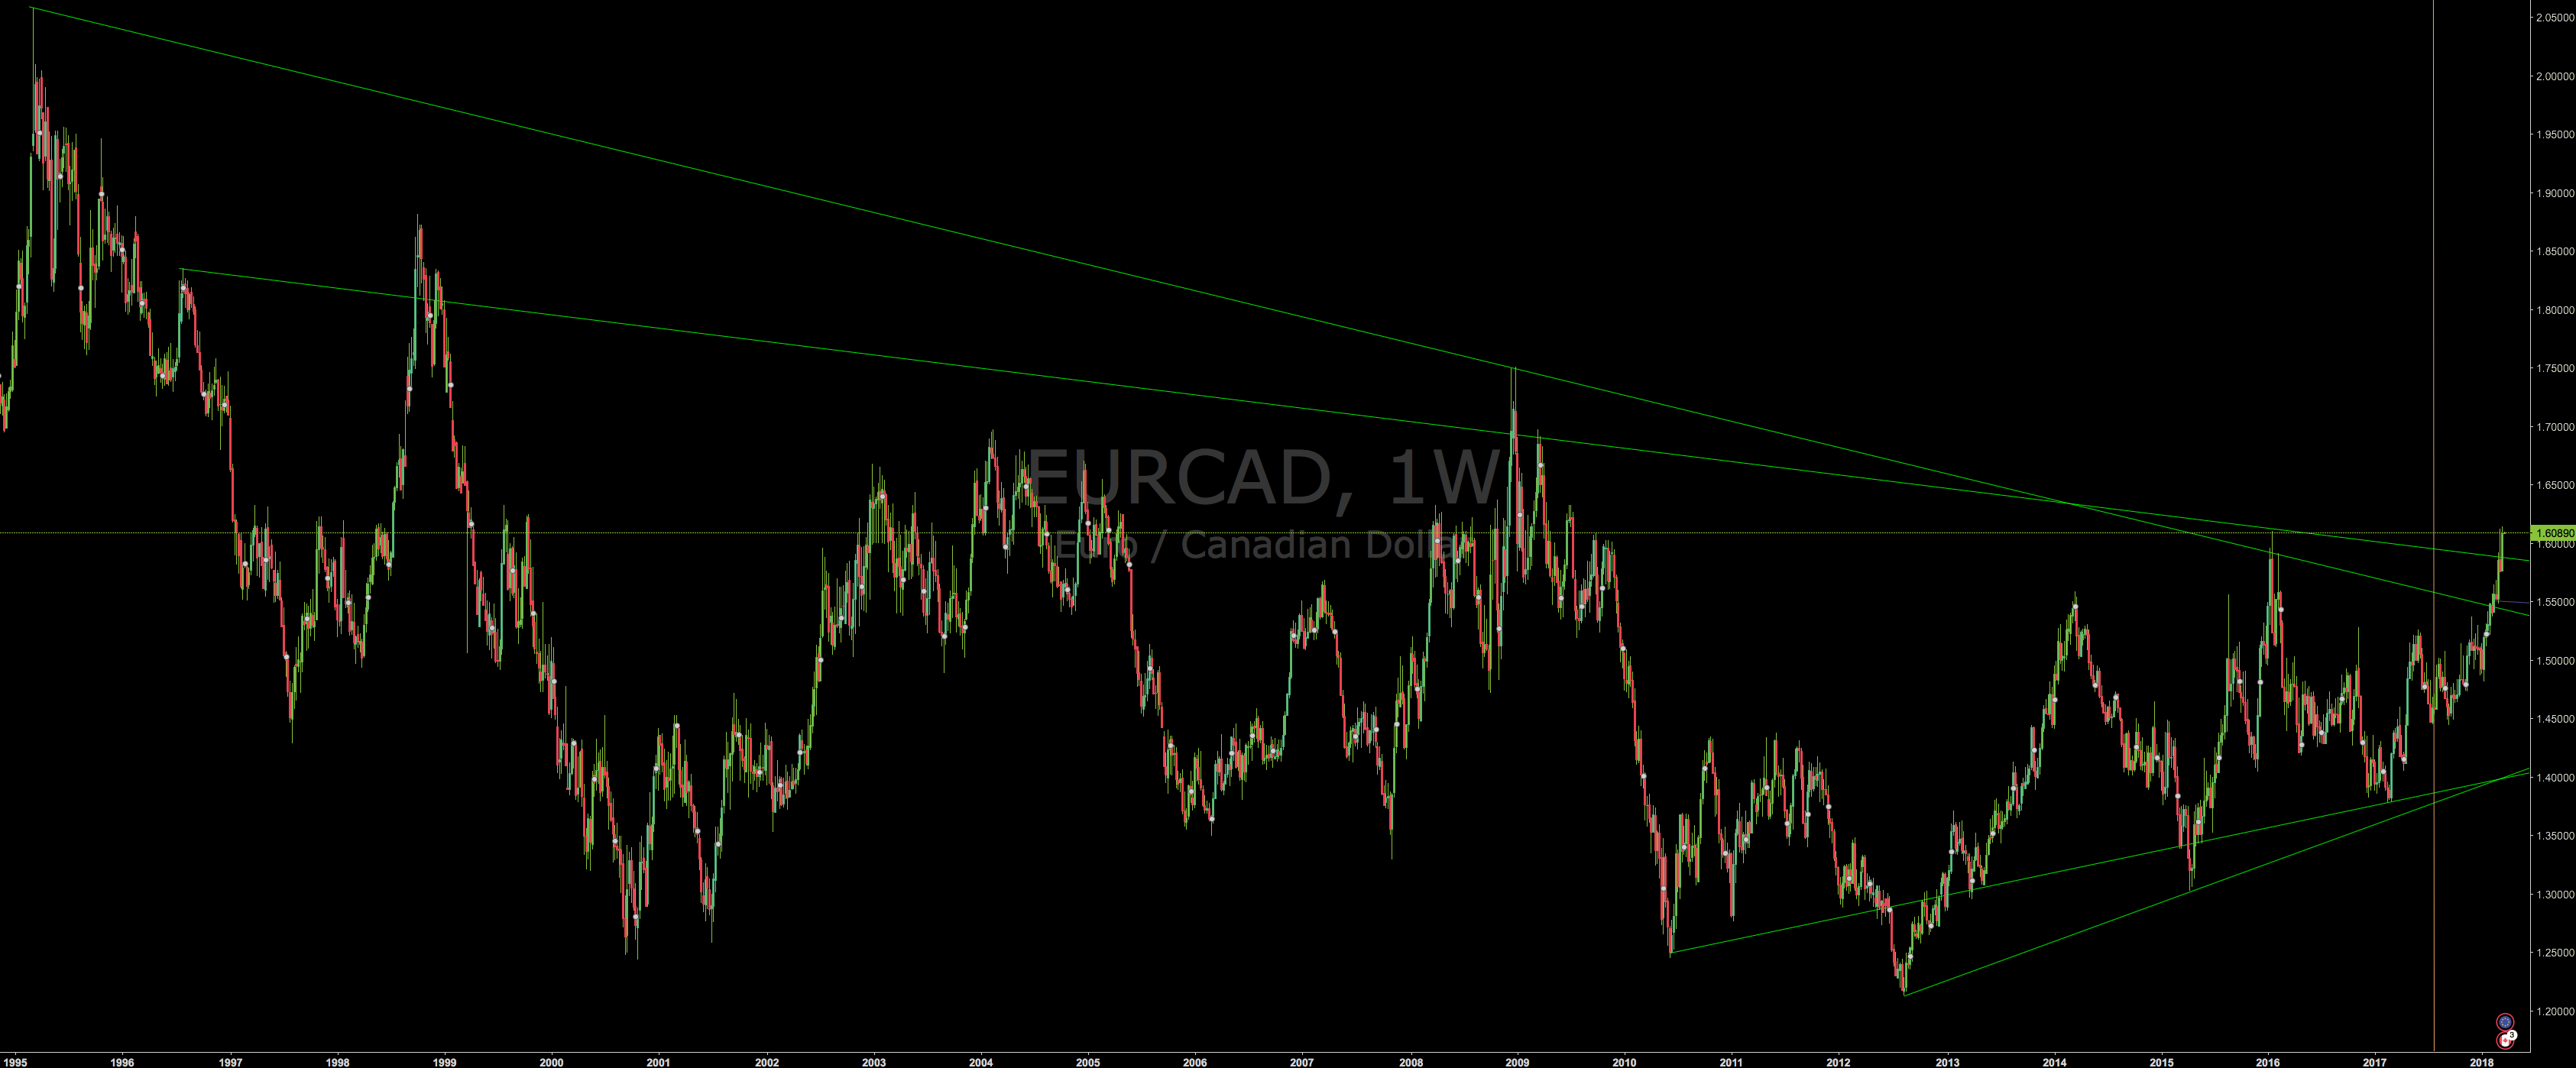
EURCAD
This looks like the best trade of my life. (investing.com)
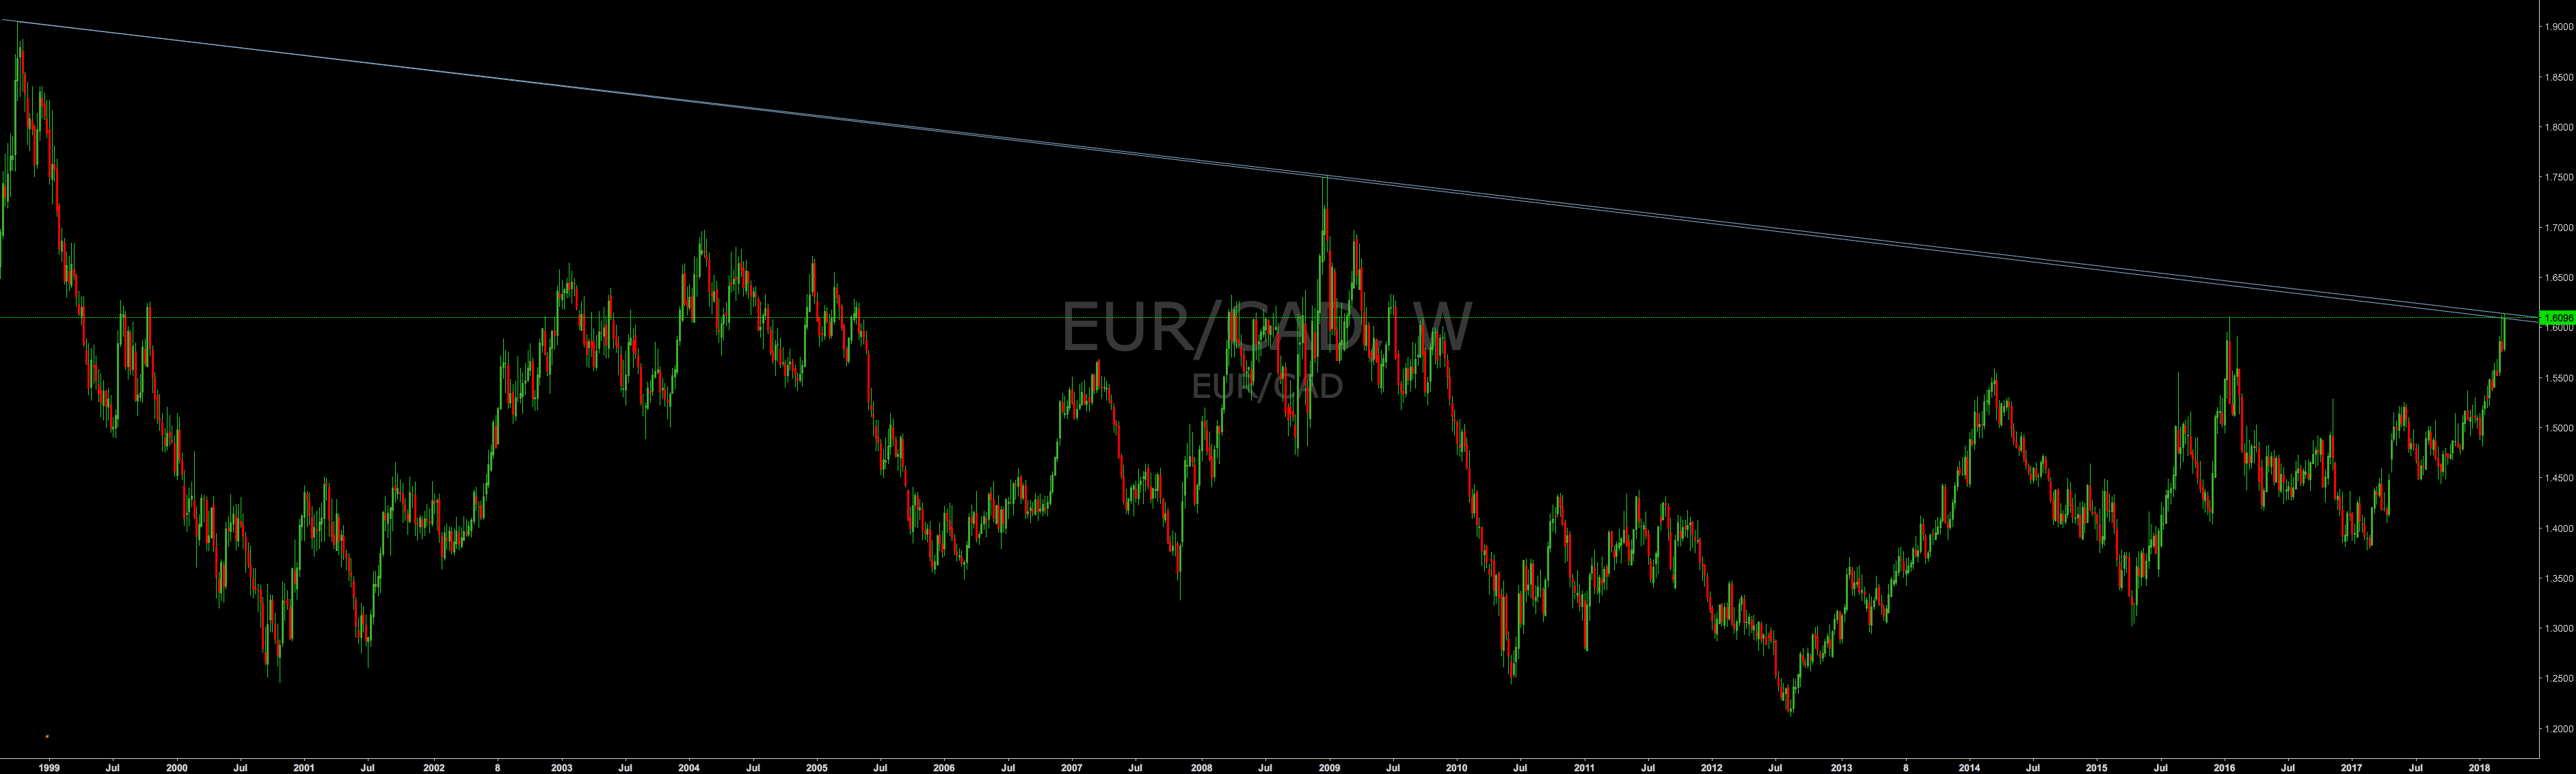
EURCAD
This looks like the best fuck off my life. (tradingview.com)
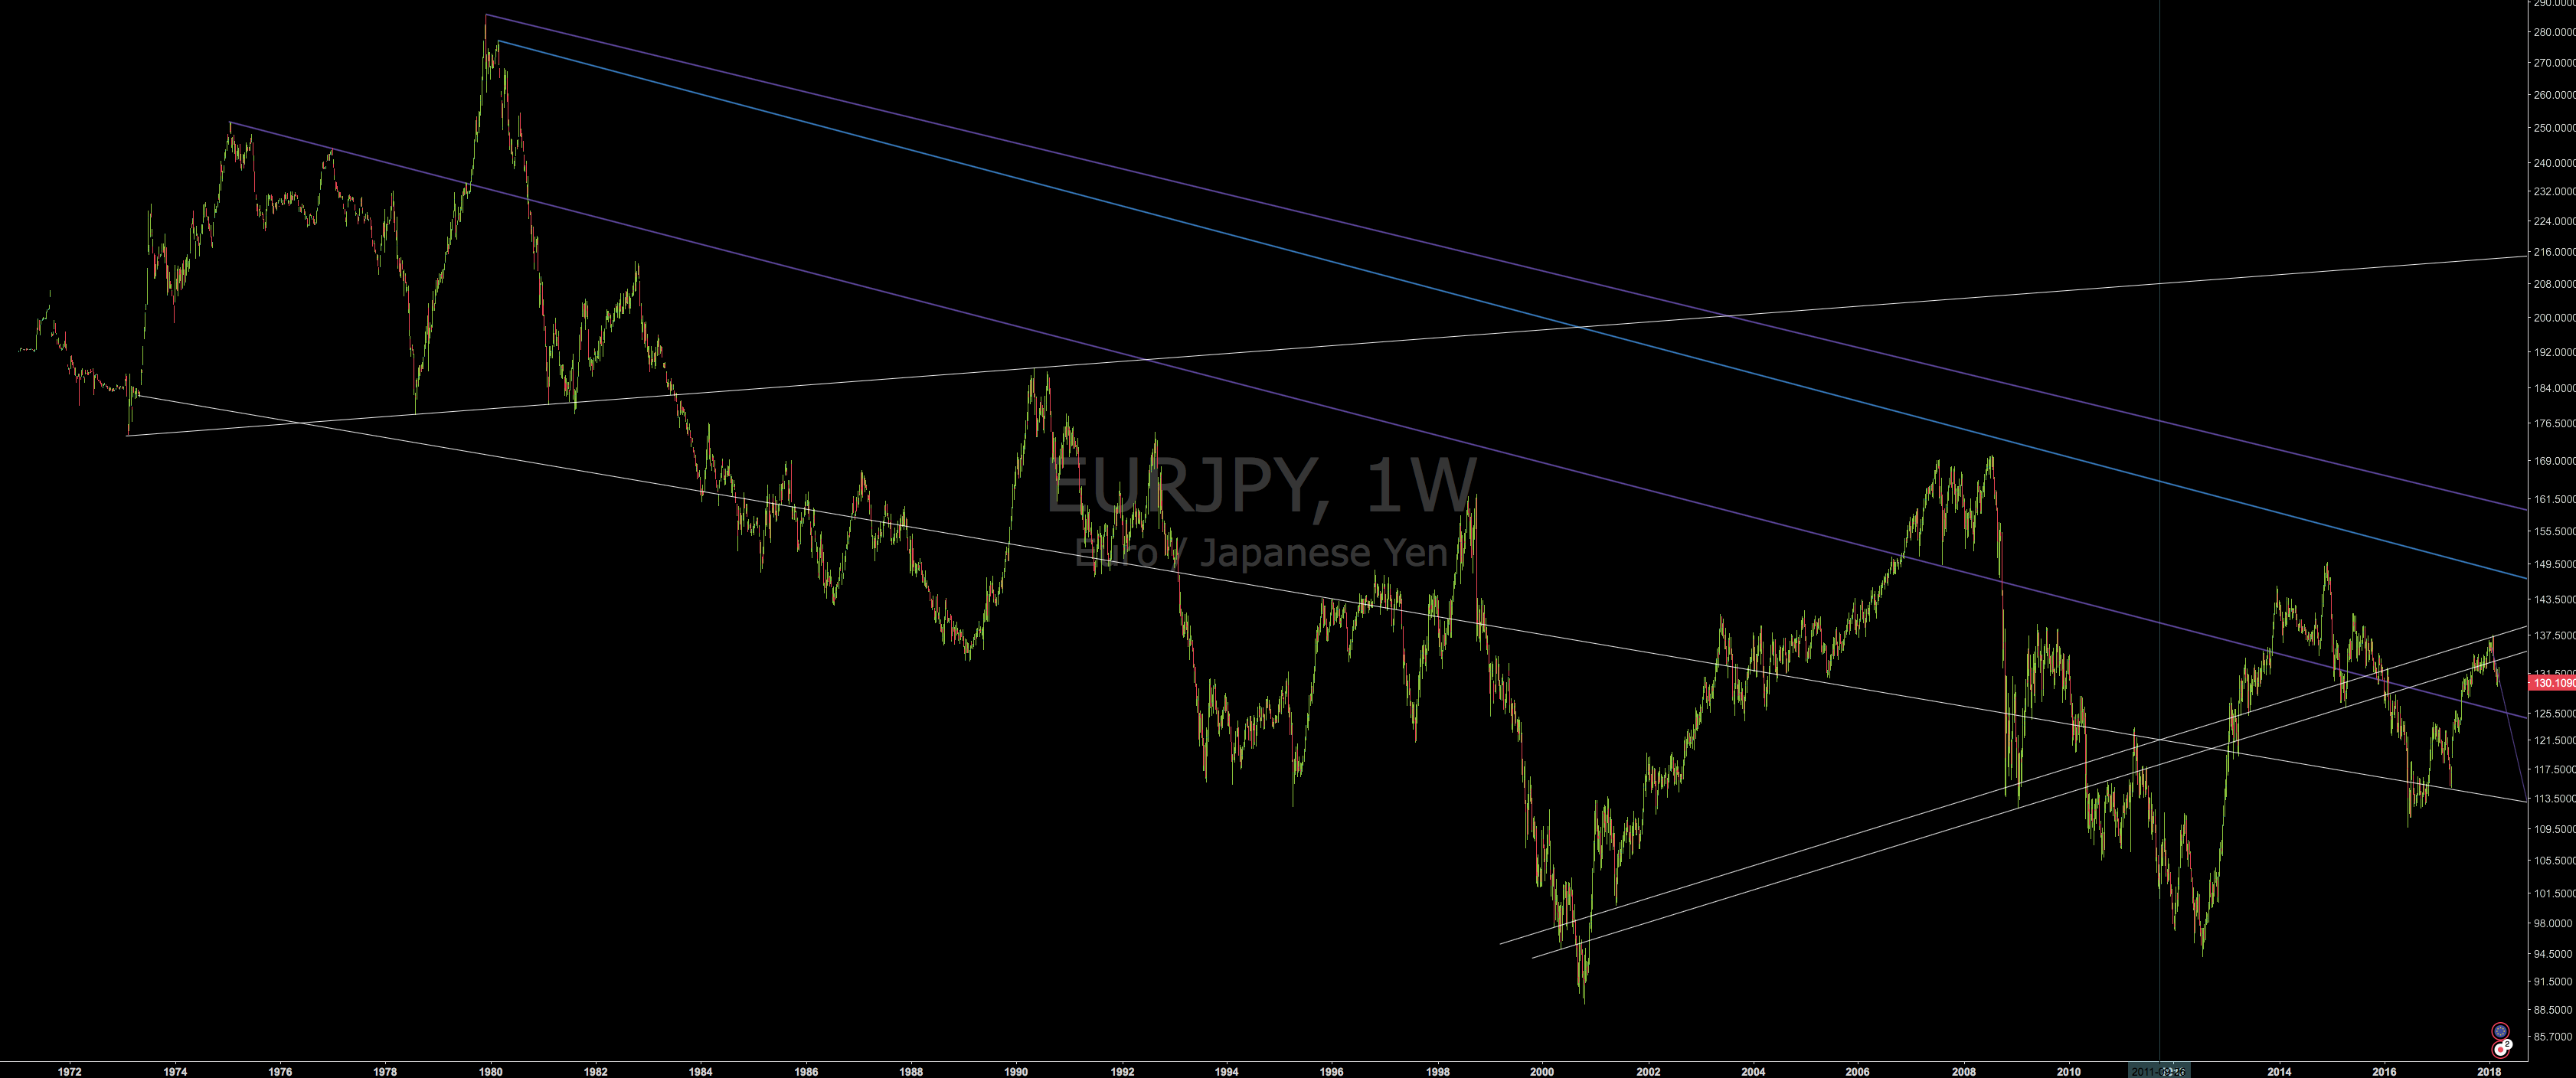
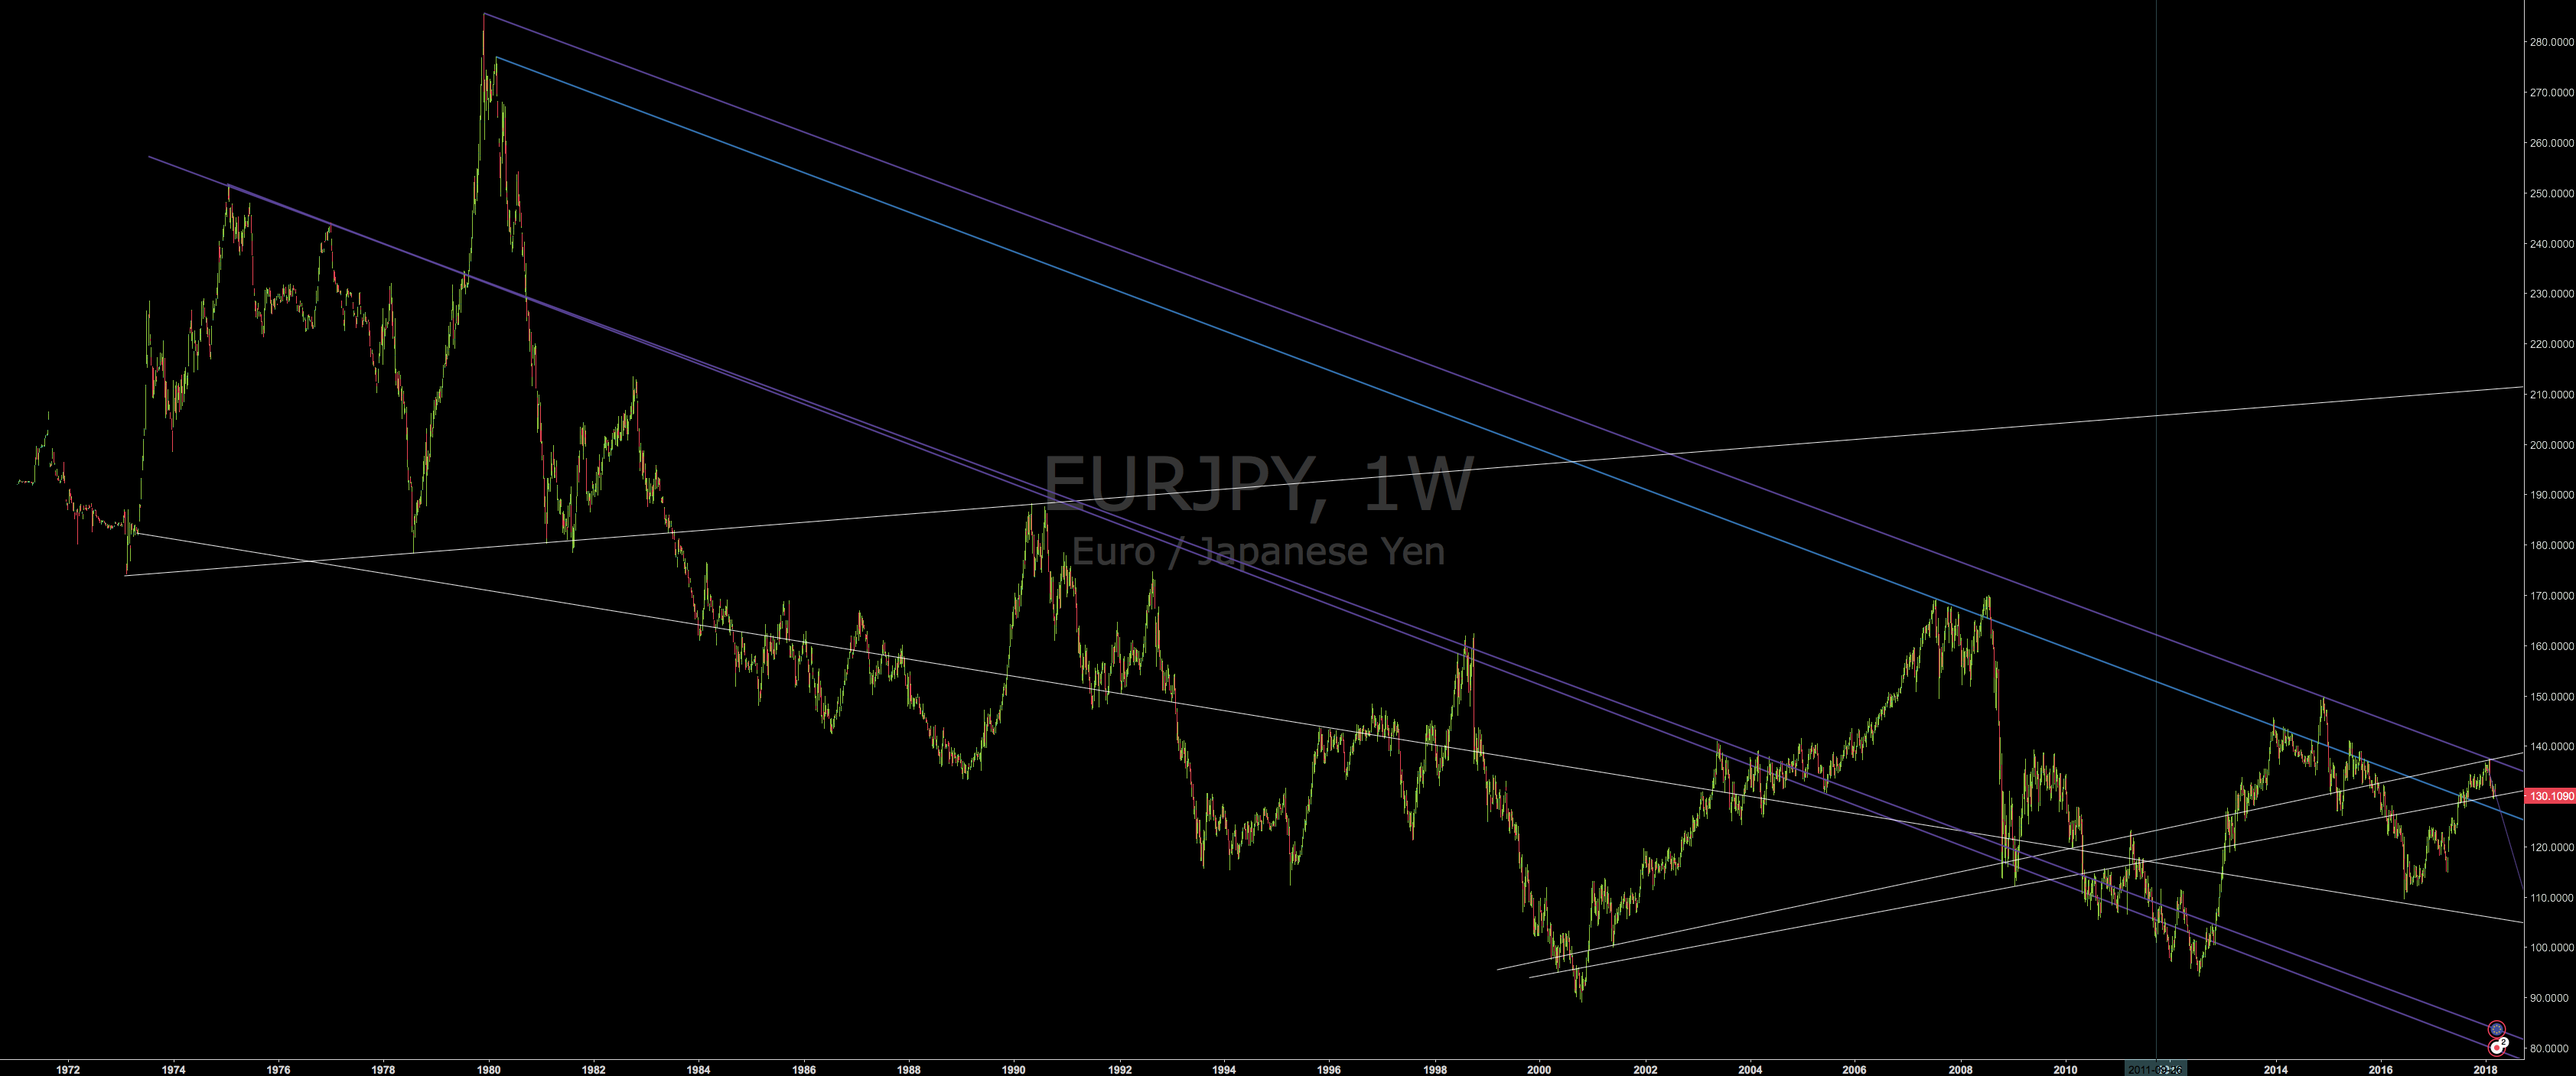
EURJPY
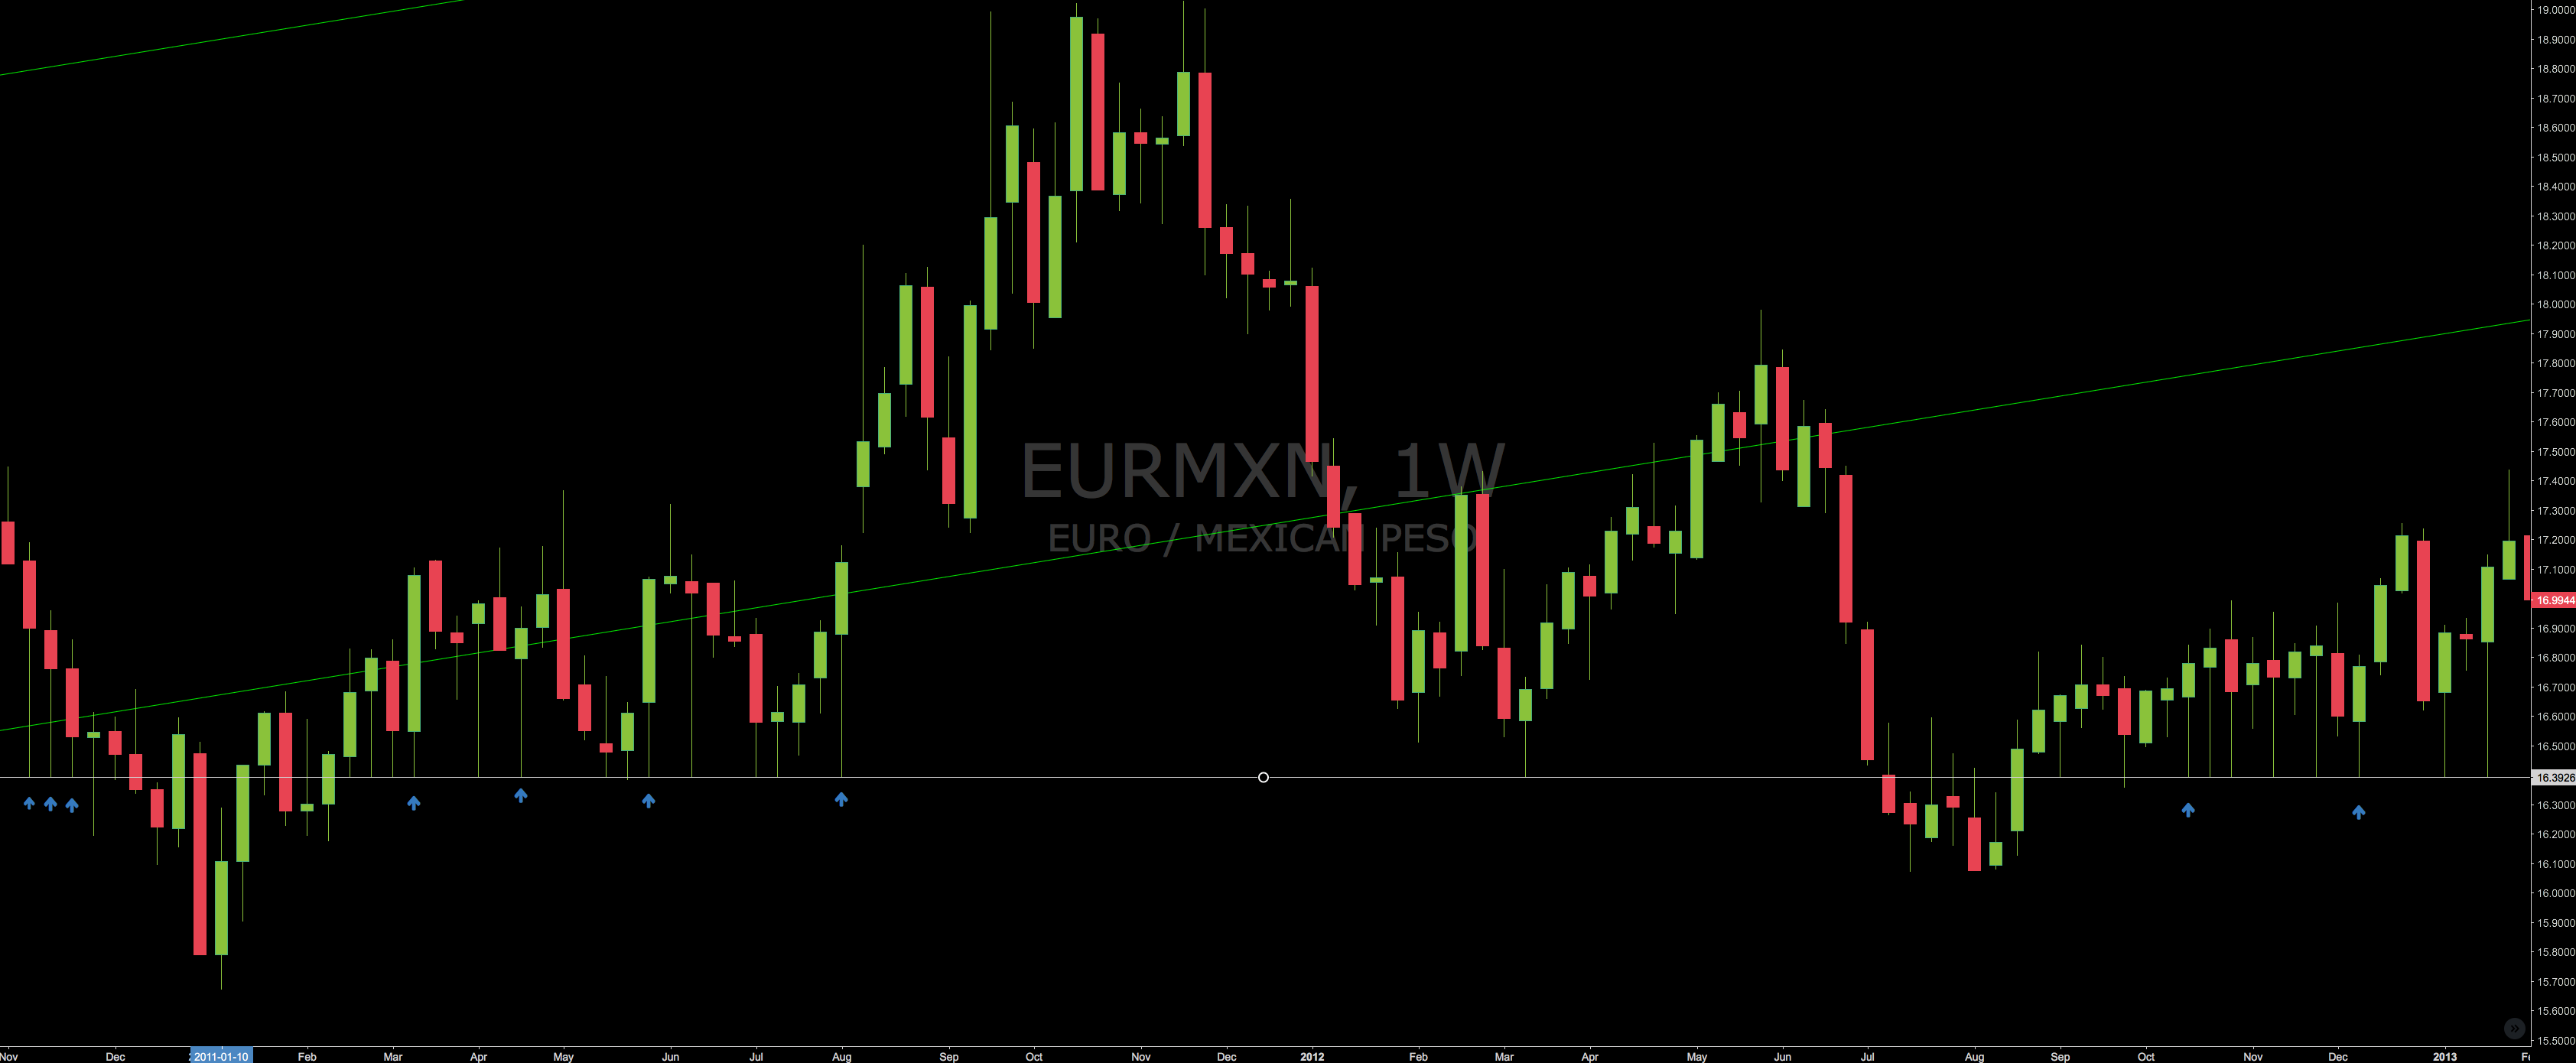
EURMXN
Lambo/week. May you please inform me when this will start happening again?
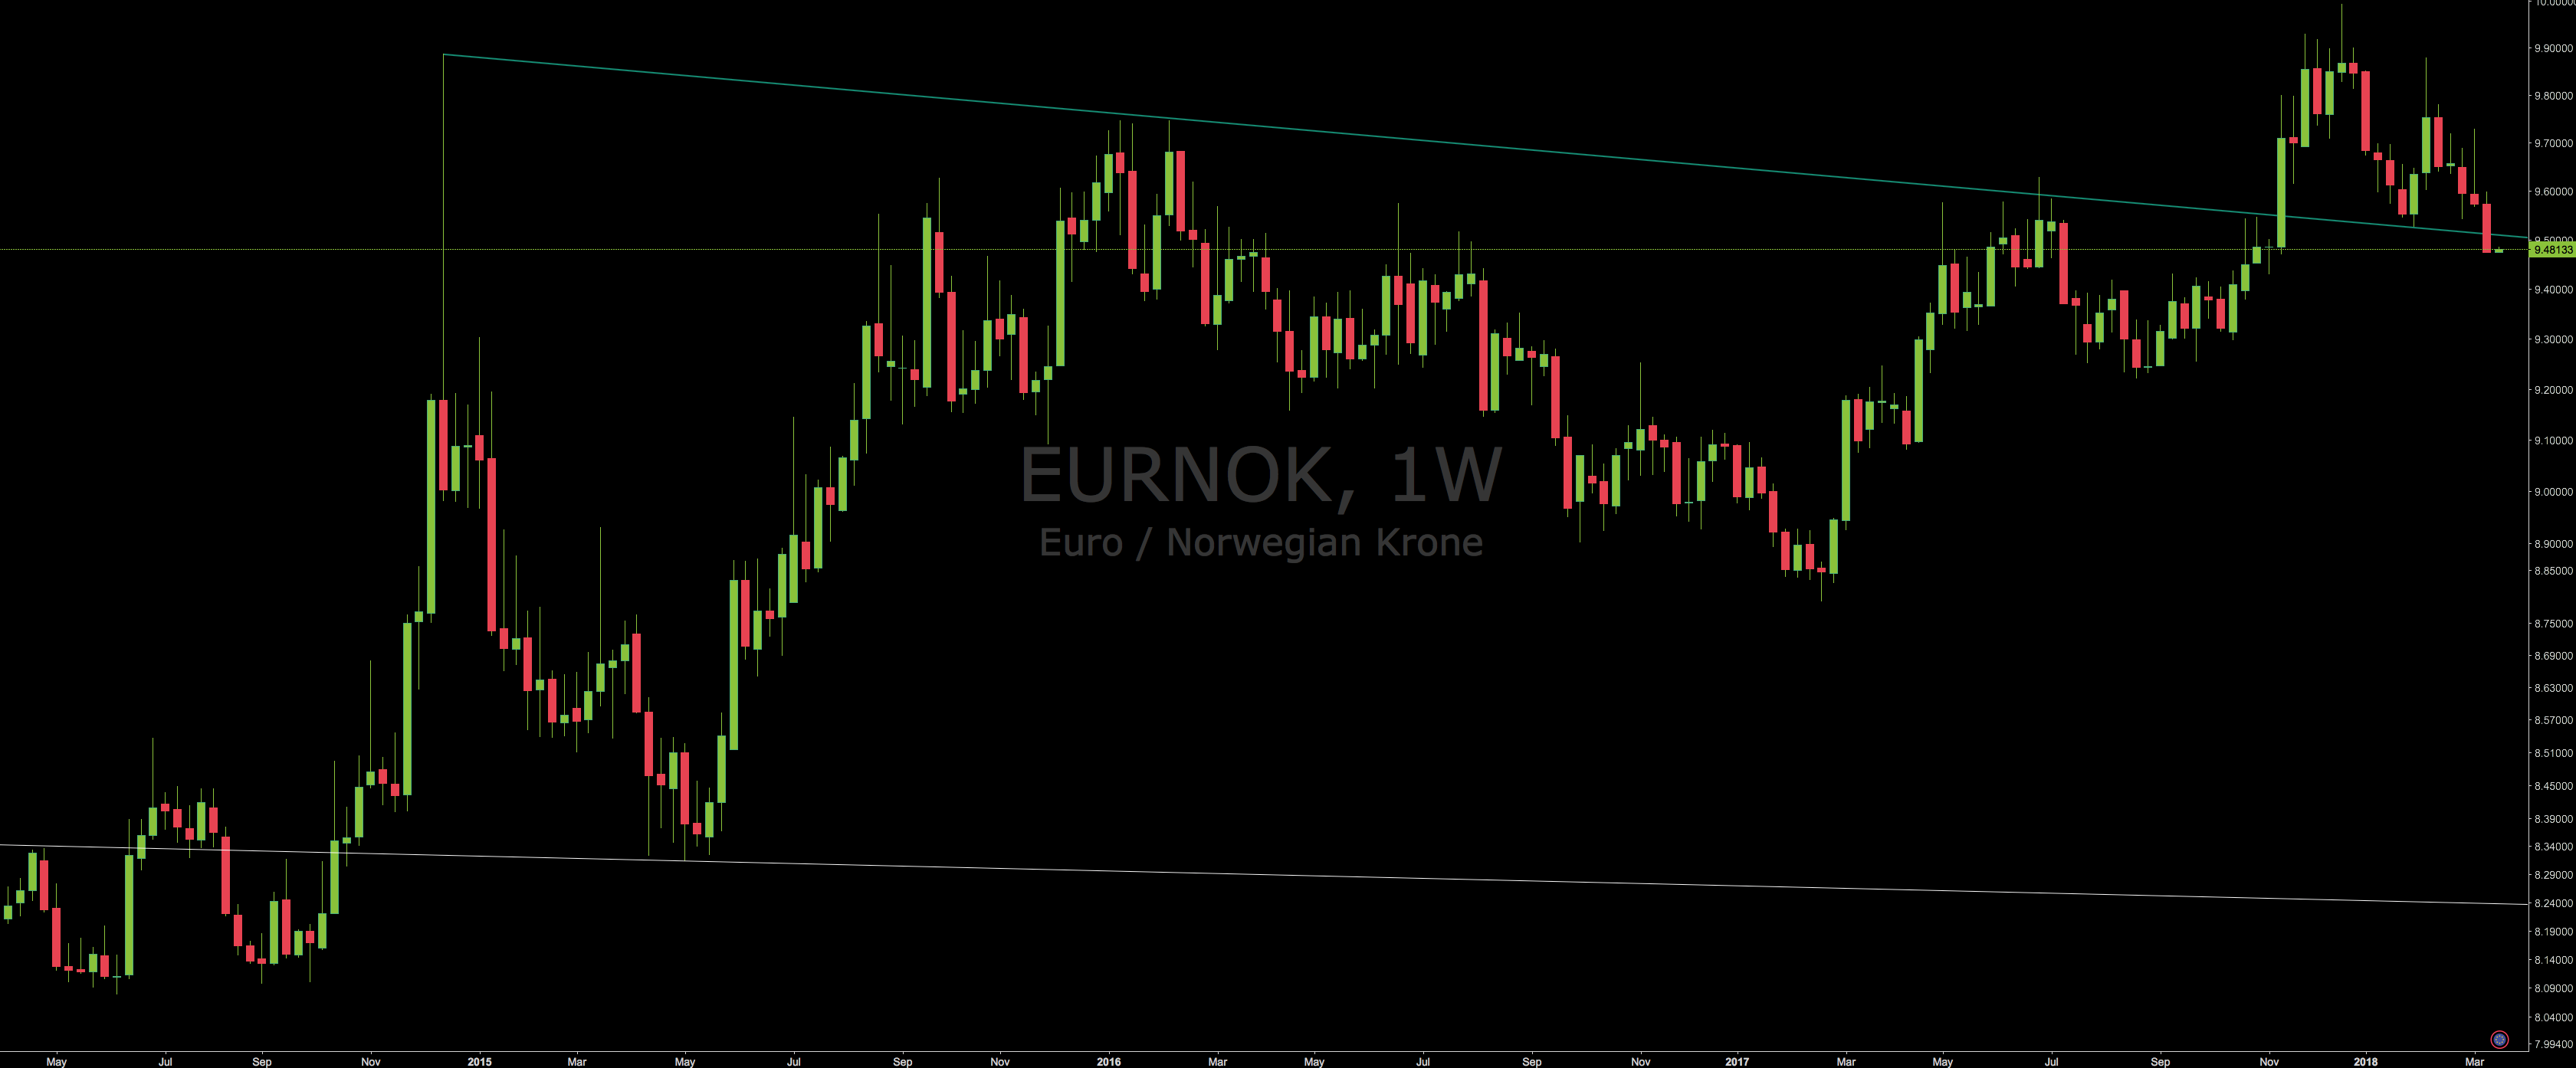
EURNOK
Sell-limit below trendline.
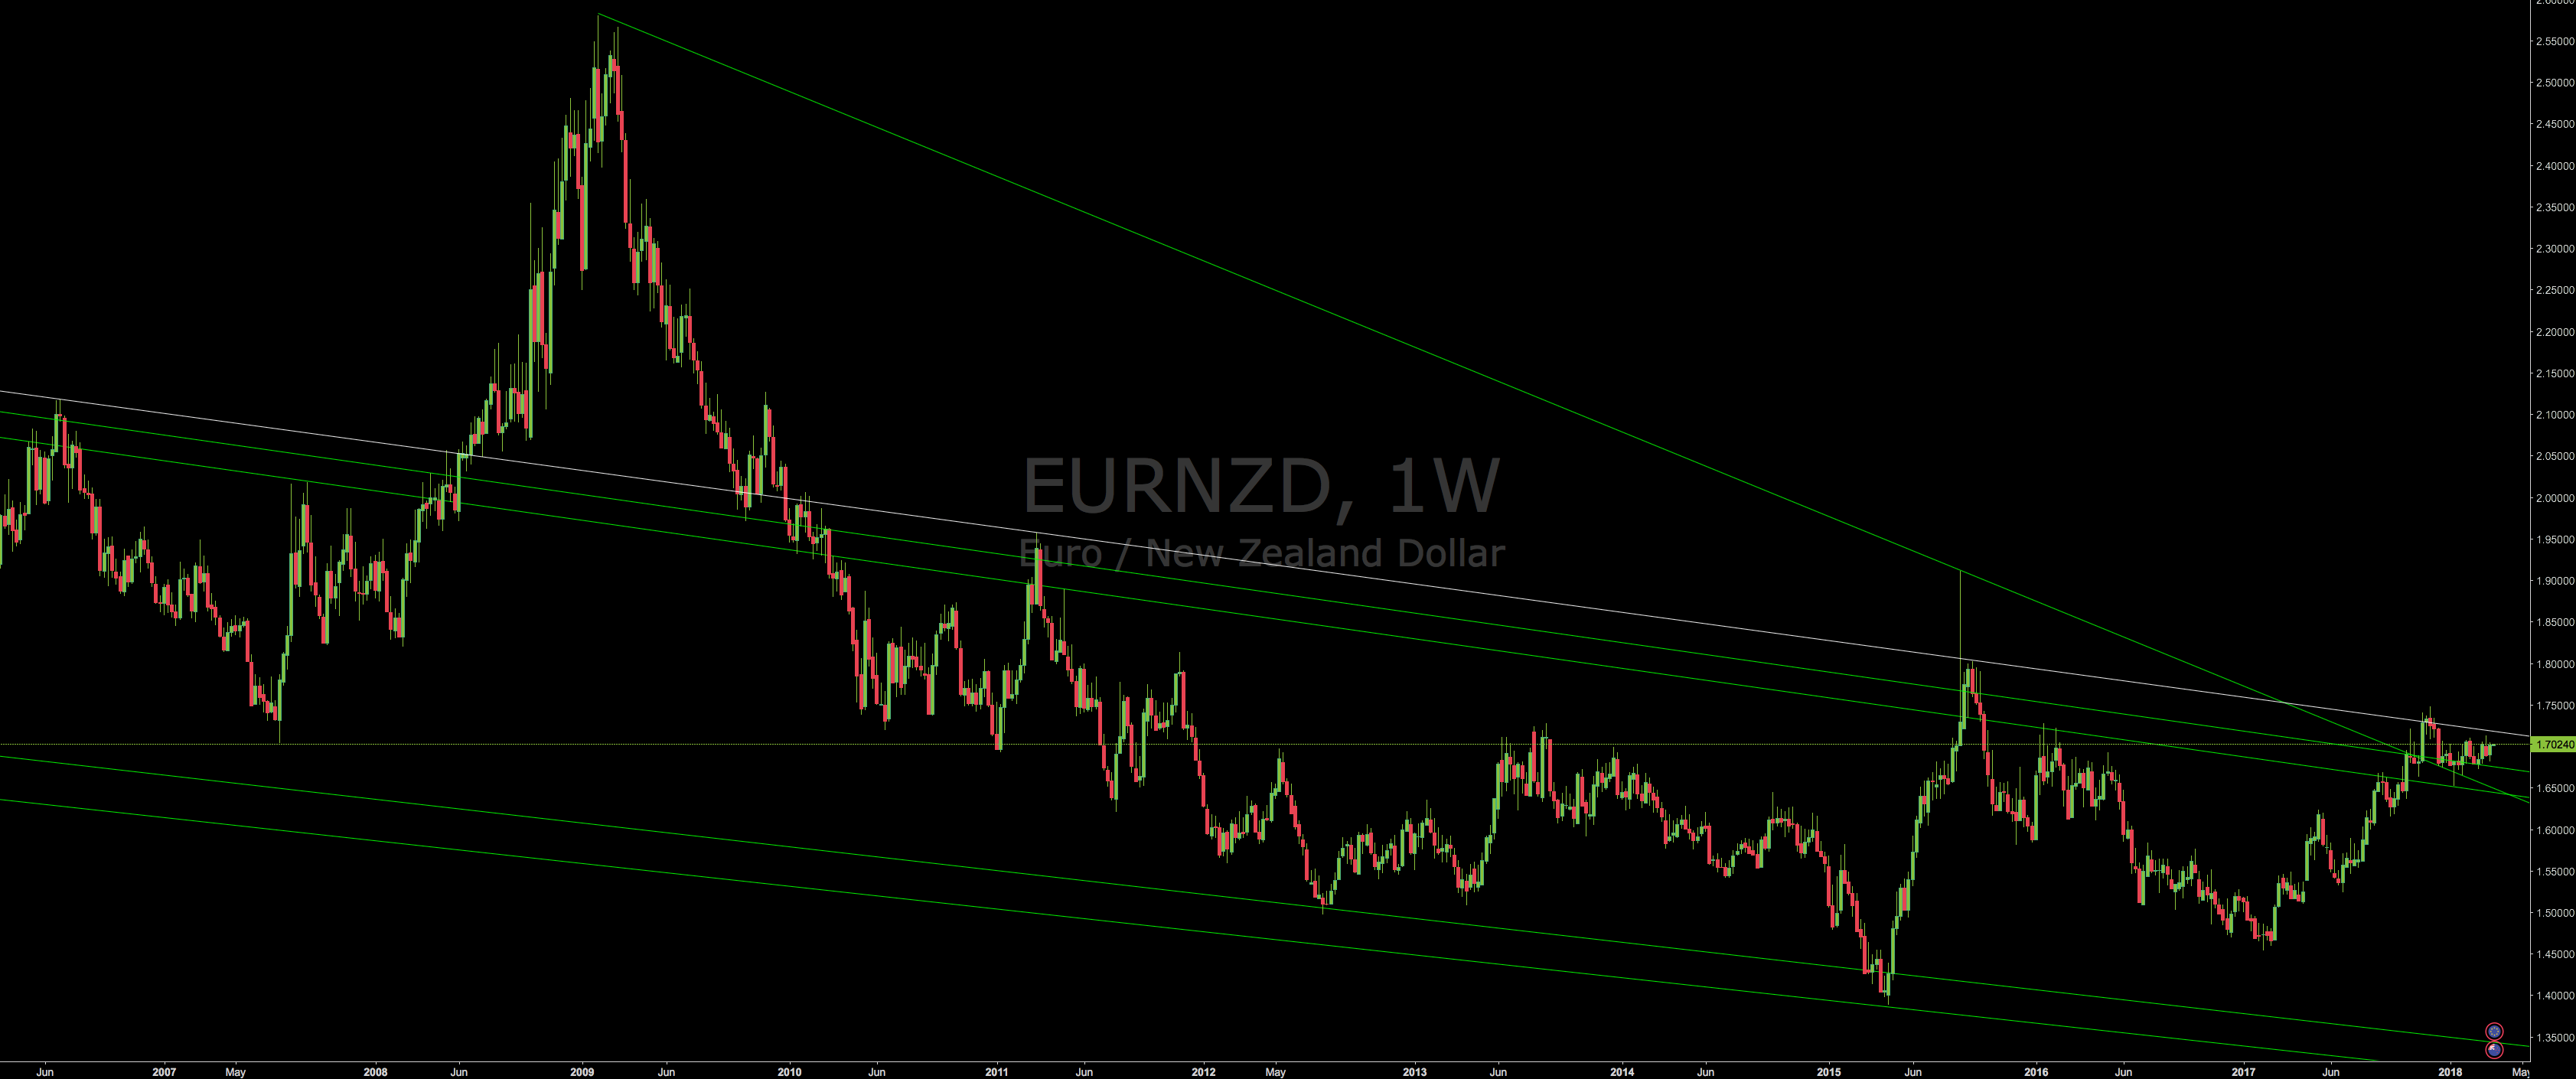
EURNZD
I am going to try to sell stop whiteline. Not sure what it will do at all.
News coming this week
- USD: Wed = Federal Funds Rate
- NZD: Wed = Cash Rate
- GBP: Thu = Bank Rate
Questions
- What is the difference between wti(short swap on Tickmill=0.27) and xtiusd(short swap on IC Market=-3.1)?
- Do you know any charting service with a free volume on a weekly/monthly timeframe?
- EUR up or down? (not sure if I should hold my EURPLN buy)
- Anyone day trading long-term trendlines?
Risk disclosure: Not a trading advice.
Sources: tradingview.com, mind
Leave Forex Technical Analysis 11S18 to:

Best Posts From stepanh
We have not curated any of stepanh's posts yet. But you can encourage our curation team to review posts by visiting them regularly and by referring other readers. Because we give priority to frequently read content.